Section 11-15
Section 11: Cloud Integration 云端集成
11.1 Section Introduction
- Synchronous between applications can be problematic if there are sudden spikes of traffic
- What if you need to suddenly encode 1000 videos but usually it’s 10?
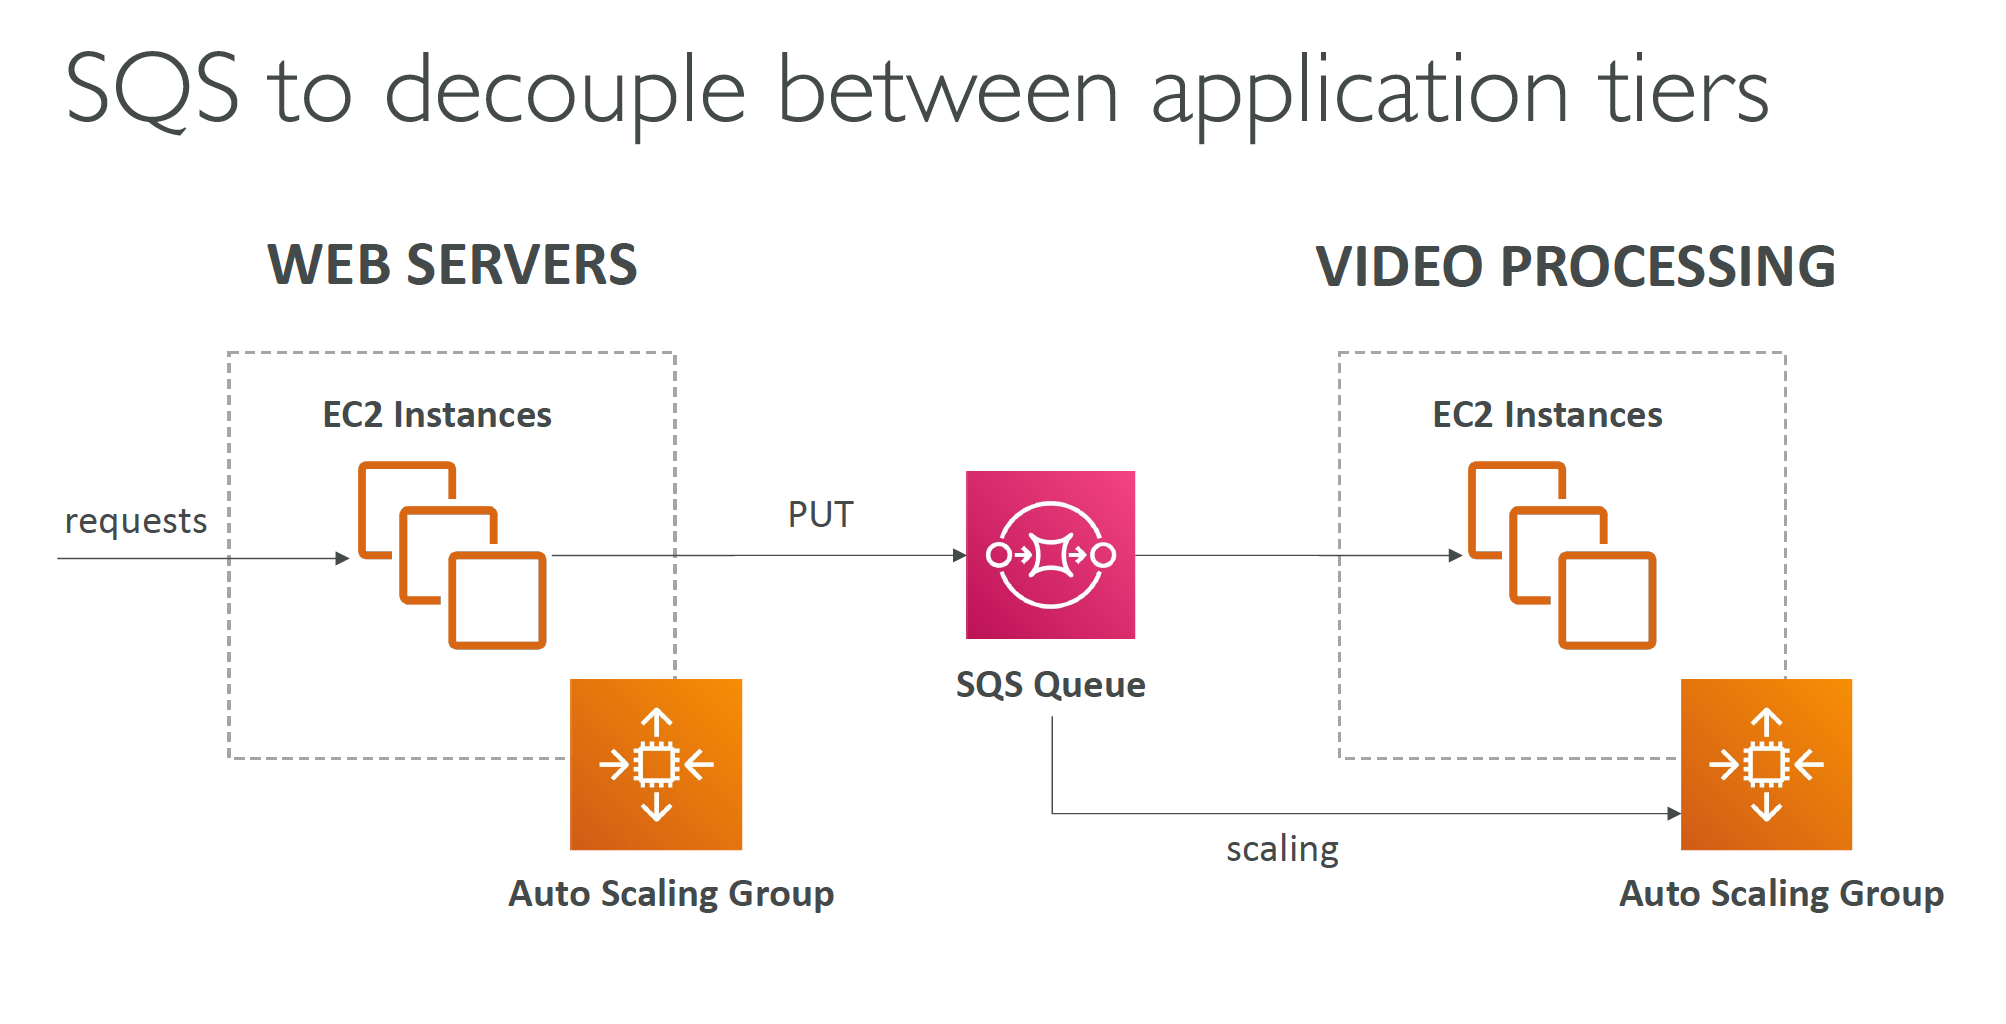
- In that case, it’s better to decouple your applications:
- using SQS: queue model
- using SNS: pub/sub model
- using Kinesis: real-time data streaming model
- These services can scale independently from our application!
11.2 Amazon SQS – Simple Queue Service 简单队列服务
- Oldest AWS offering (over 10 years old)
- Fully managed service (~serverless), use to decouple applications
- Scales from 1 message per second to 10,000s per second
- Default retention of messages: 4 days, maximum of 14 days
- No limit to how many messages can be in the queue
- Messages are deleted after they’re read by consumers. 消息在被消费者读取后被删除。
- Low latency (
<10 mson publish and receive) - Consumers share the work to read messages & scale horizontally. 消费者共享读取消息的工作并水平扩展。
11.3 Amazon Kinesis – Real-time Data Streaming
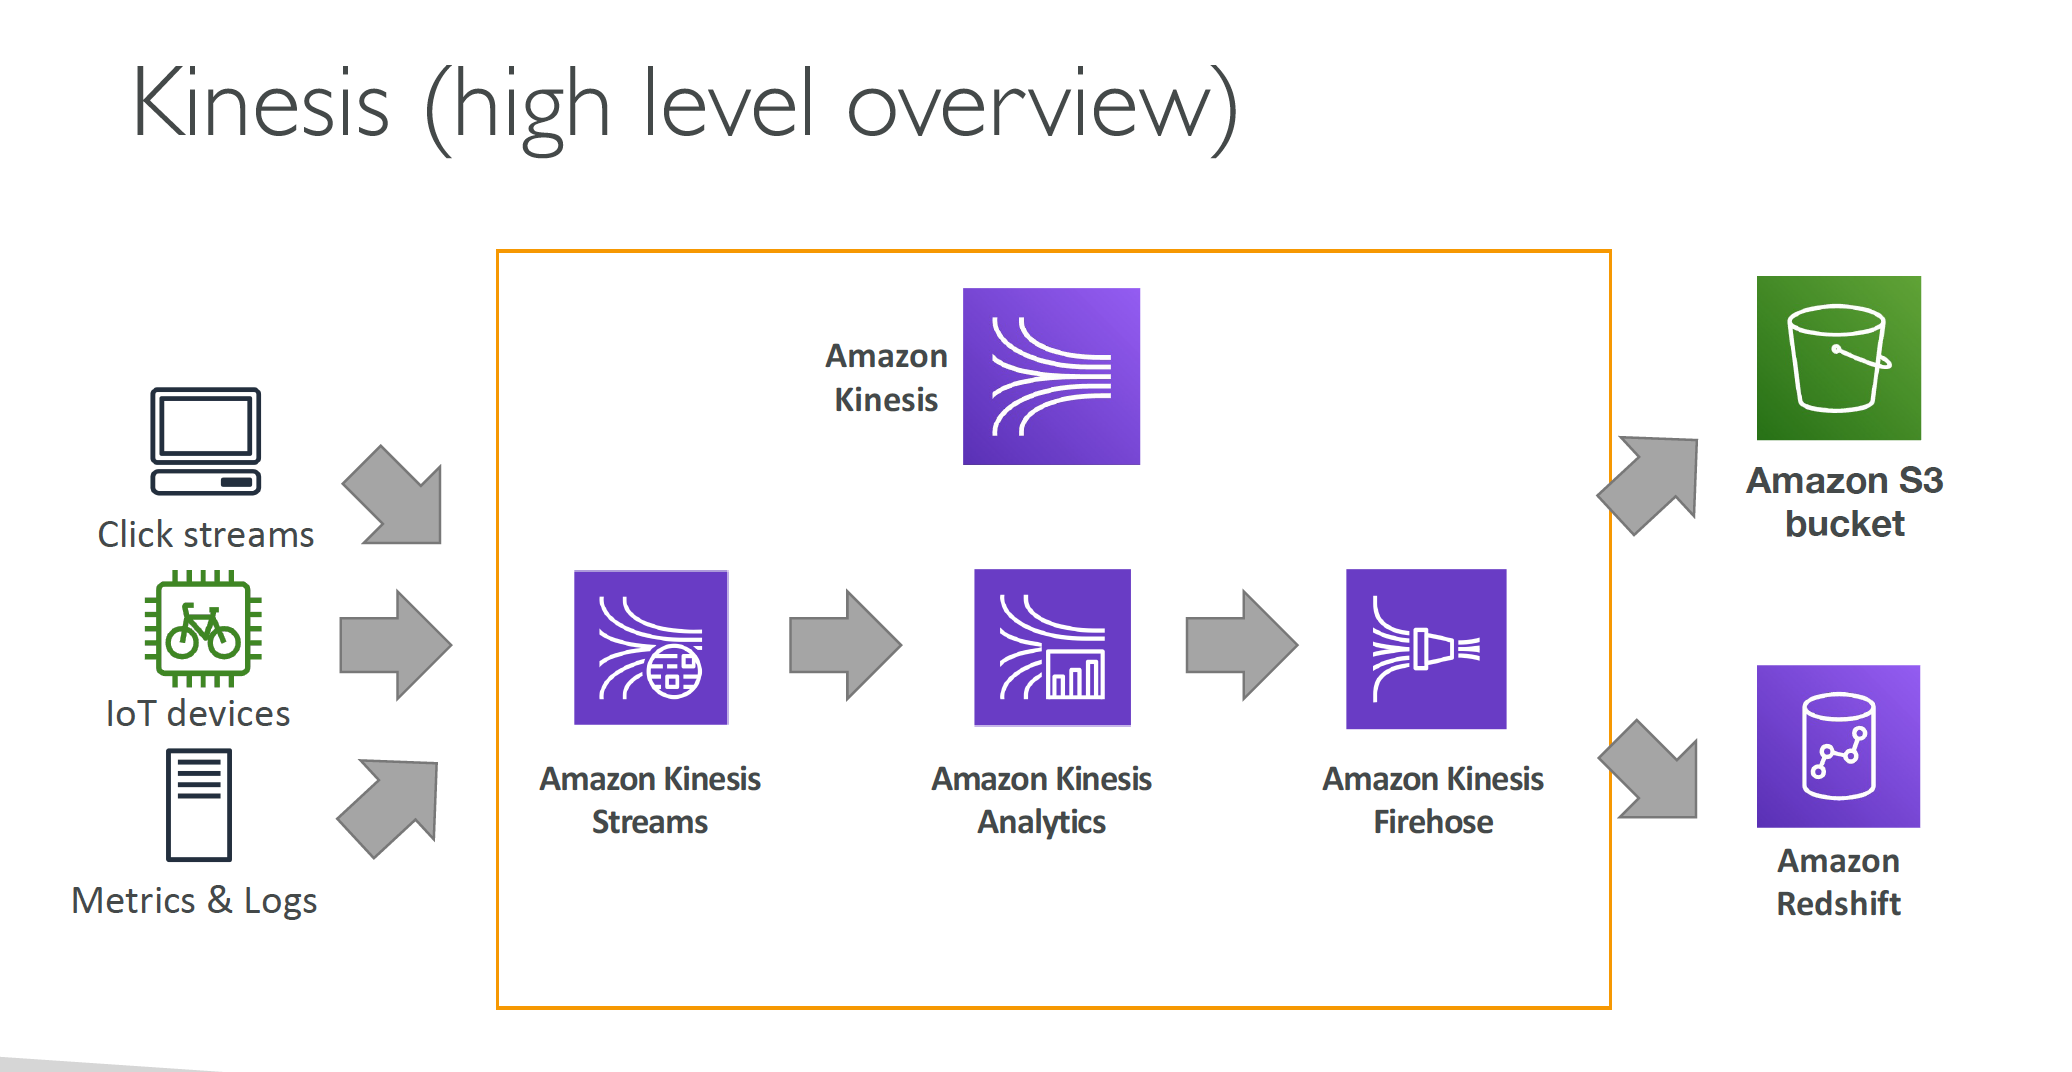
- For the exam: Kinesis = real-time big data streaming
- Managed service to collect, process, and analyze real-time streaming data at any scale. 用于在任何规模上收集,处理和分析实时流数据的托管服务。
- Too detailed for the Cloud Practitioner exam but good to know:
- Kinesis Data Streams: low latency streaming to ingest data at scale from hundreds of thousands of sources. 低延迟流,从数十万个来源中批量收集数据。
- Kinesis Data Firehose: load streams into S3, Redshift, ElasticSearch, etc…. 将流加载到 S3,Redshift,ElasticSearch 等。
- Kinesis Data Analytics: perform real-time analytics on streams using SQL. 使用 SQL 对流进行实时分析。
- Kinesis Video Streams: monitor real-time video streams for analytics or ML. 监控实时视频流以进行分析或机器学习。
11.4 Amazon SNS – Simple Notification Service 简单通知服务
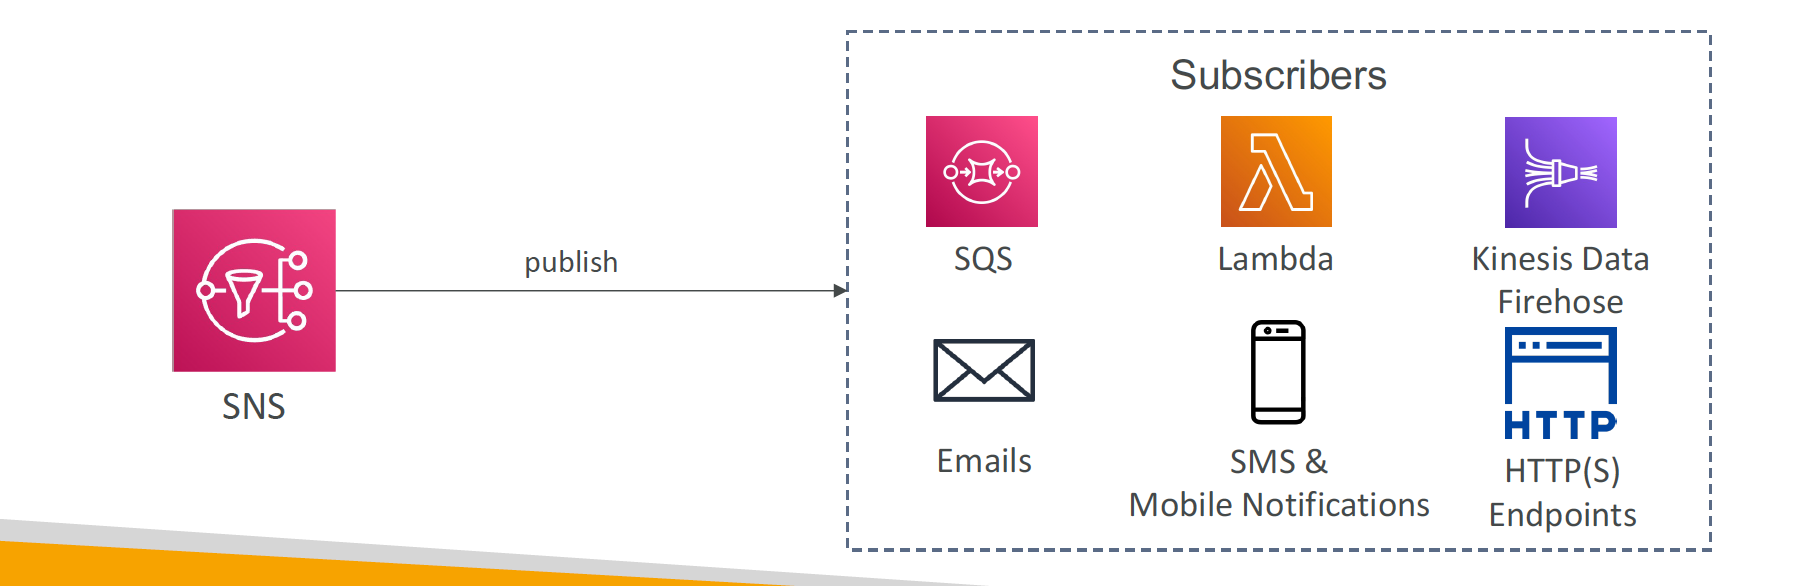
- The “event publishers” only sends message to one SNS topic. 事件发布者只将消息发送到一个 SNS 主题。
- As many “event subscribers” as we want to listen to the SNS topic notifications
- Each subscriber to the topic will get all the messages. 每个订阅者都会收到所有消息。
- Up to 12,500,000 subscriptions per topic, 100,000 topics limit
11.5 Amazon MQ – Managed Message Broker 面向开源消息代理的完全托管式服务
- SQS, SNS are “cloud-native” services: proprietary protocols from AWS. SQS,SNS 是“云原生”服务:来自 AWS 的专有协议。
- Traditional applications running from on-premises may use open protocols such as: MQTT, AMQP, STOMP, Openwire, WSS
- When migrating to the cloud, instead of re-engineering the application to use SQS and SNS, we can use Amazon MQ. 当迁移到云时,我们可以使用 Amazon MQ 而不是重新设计应用程序以使用 SQS 和 SNS。
- Amazon MQ is a managed message broker service for
RabbitMQandActiveMQ - Amazon MQ doesn’t “scale” as much as SQS / SNS
- Amazon MQ runs on servers, can run in Multi-AZ with failover
- Amazon MQ has both queue feature (~SQS) and topic features (~SNS)
11.6 Integration Section – Summary
- SQS:
- Queue service in AWS. AWS 中的队列服务。
- Multiple Producers, messages are kept up to 14 days
- Multiple Consumers share the read and delete messages when done
- Used to decouple applications in AWS
- It uses a pull-based system.
- SNS:
- Notification service in AWS. AWS 中的通知服务。
- Subscribers: Email, Lambda, SQS, HTTP, Mobile…
- Multiple Subscribers, send all messages to all of them
- No message retention
- Kinesis: real-time data streaming, persistence and analysis. 实时数据流,持久化和分析。
- Amazon MQ: managed message broker for ActiveMQ and RabbitMQ in the cloud (MQTT, AMQP.. protocols). 在云中管理的消息代理,用于 ActiveMQ 和 RabbitMQ。
Section 12: Cloud Monitoring 云监控
12.1 Amazon CloudWatch – Monitoring Service
1. Amazon CloudWatch Metrics
- CloudWatch provides metrics for every services in AWS. CloudWatch 为 AWS 中的每个服务提供指标。
- Metric is a variable to monitor (CPUUtilization, NetworkIn…)
- Metrics have timestamps
- Can create CloudWatch dashboards of metrics
Important Metrics
- EC2 instances: CPU Utilization, Status Checks, Network (not RAM).
- Default metrics every 5 minutes
- Option for Detailed Monitoring ($$$): metrics every 1 minute
- EBS volumes: Disk Read/Writes
- S3 buckets: BucketSizeBytes, NumberOfObjects, AllRequests
- Billing: Total Estimated Charge (only in us-east-1)
- Service Limits: how much you’ve been using a service API
- Custom metrics: push your own metrics
2. Amazon CloudWatch Alarms
- Alarms are used to trigger notifications for any metric. 用于为任何指标触发通知的警报。
- Alarms actions…
- Auto Scaling: increase or decrease EC2 instances “desired” count
- EC2 Actions: stop, terminate, reboot or recover an EC2 instance
- SNS notifications: send a notification into an SNS topic
- Various options (sampling, %, max, min, etc…)
- Can choose the period on which to evaluate an alarm
- Example: create a billing alarm on the CloudWatch Billing metric
- Alarm States: OK. INSUFFICIENT_DATA, ALARM
3. Amazon CloudWatch Logs
- CloudWatch Logs can collect log from:
- Elastic Beanstalk: collection of logs from application
- ECS: collection from containers
- AWS Lambda: collection from function logs
- CloudTrail based on filter
- CloudWatch log agents: on EC2 machines or on-premises servers
- Route53: Log DNS queries
- Enables real-time monitoring of logs. 启用日志的实时监控。
- Adjustable CloudWatch Logs retention. 可调整的 CloudWatch 日志保留期。
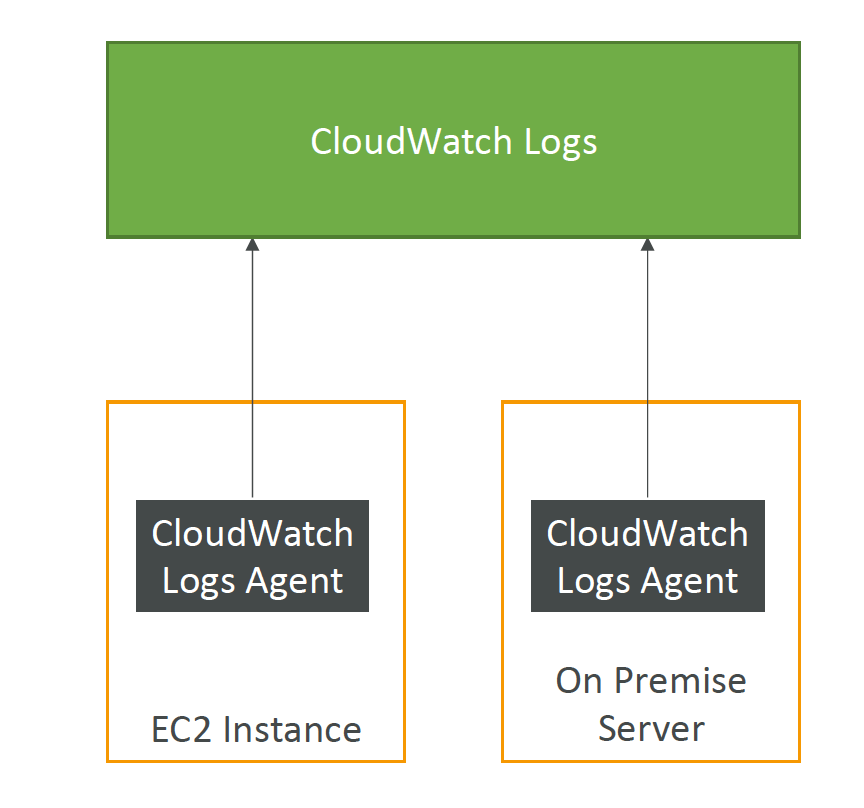
- By default, no logs from your EC2 instance will go to CloudWatch. 默认情况下,您的 EC2 实例中不会有日志。
- You need to run a CloudWatch agent on EC2 to push the log files you want. 您需要在 EC2 上运行 CloudWatch 代理,以推送您想要的日志文件。
- Make sure IAM permissions are correct
- The CloudWatch log agent can be setup on-premises too EC2
12.2 Amazon EventBridge (formerly CloudWatch Events)
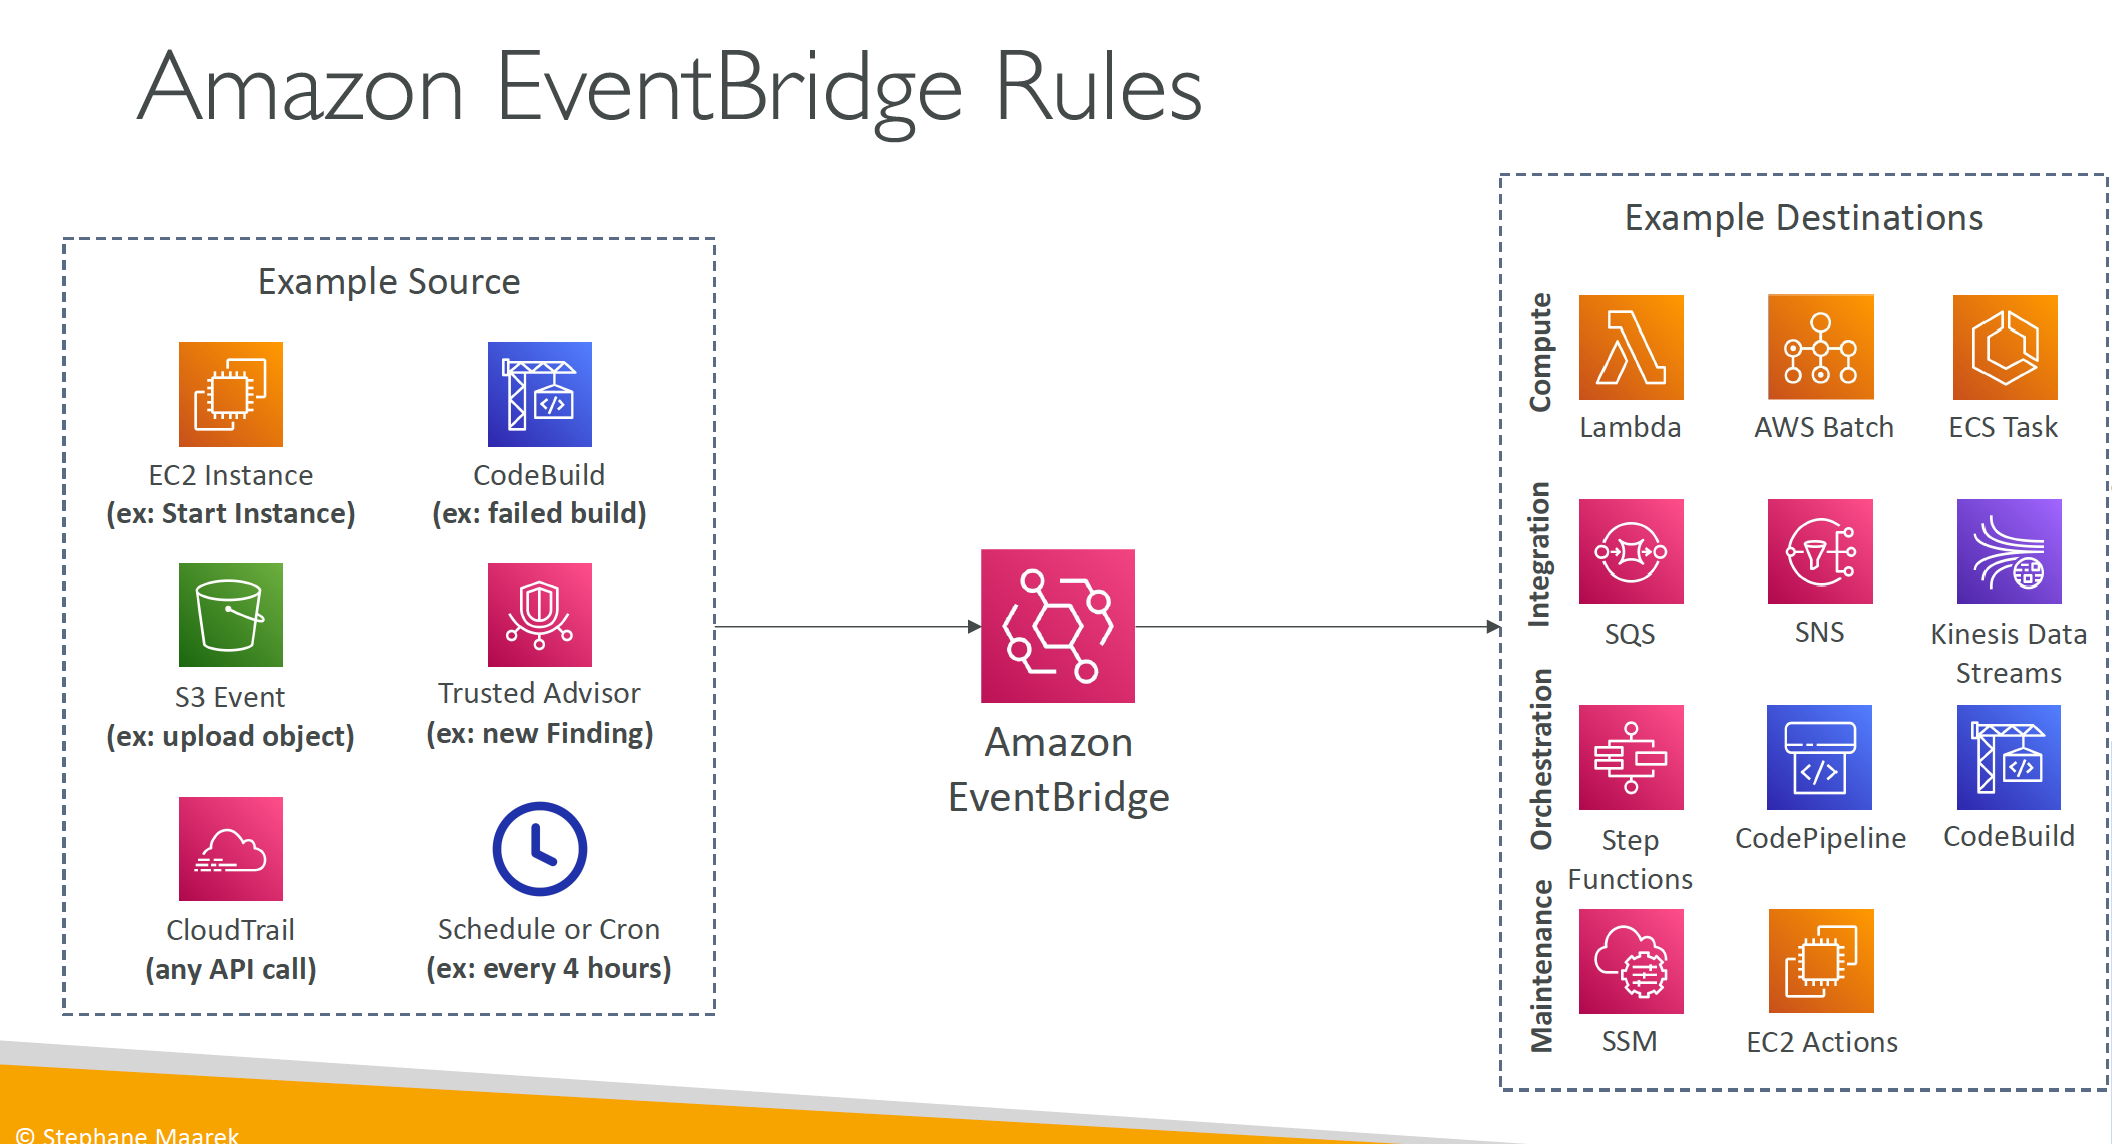
- Schedule: Cron jobs (scheduled scripts)
- Event Pattern: Event rules to react to a service doing something
- Trigger Lambda functions, send SQS/SNS messages…
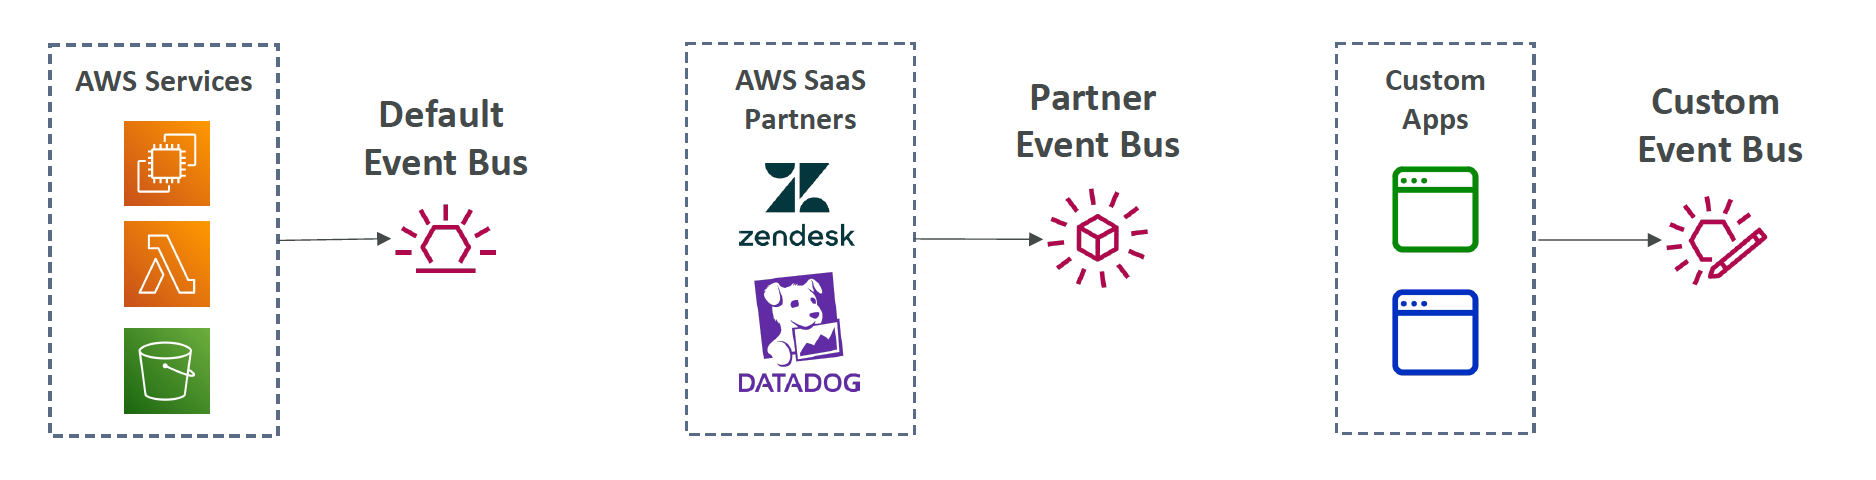
- Schema Registry: model event schema
- You can archive events (all/filter) sent to an event bus (indefinitely or set period). 您可以存档发送到事件总线的事件(无限期或设置期限)。
- Ability to replay archived events. 能够重播存档事件。
12.3 AWS CloudTrail – Audit Service 审计服务
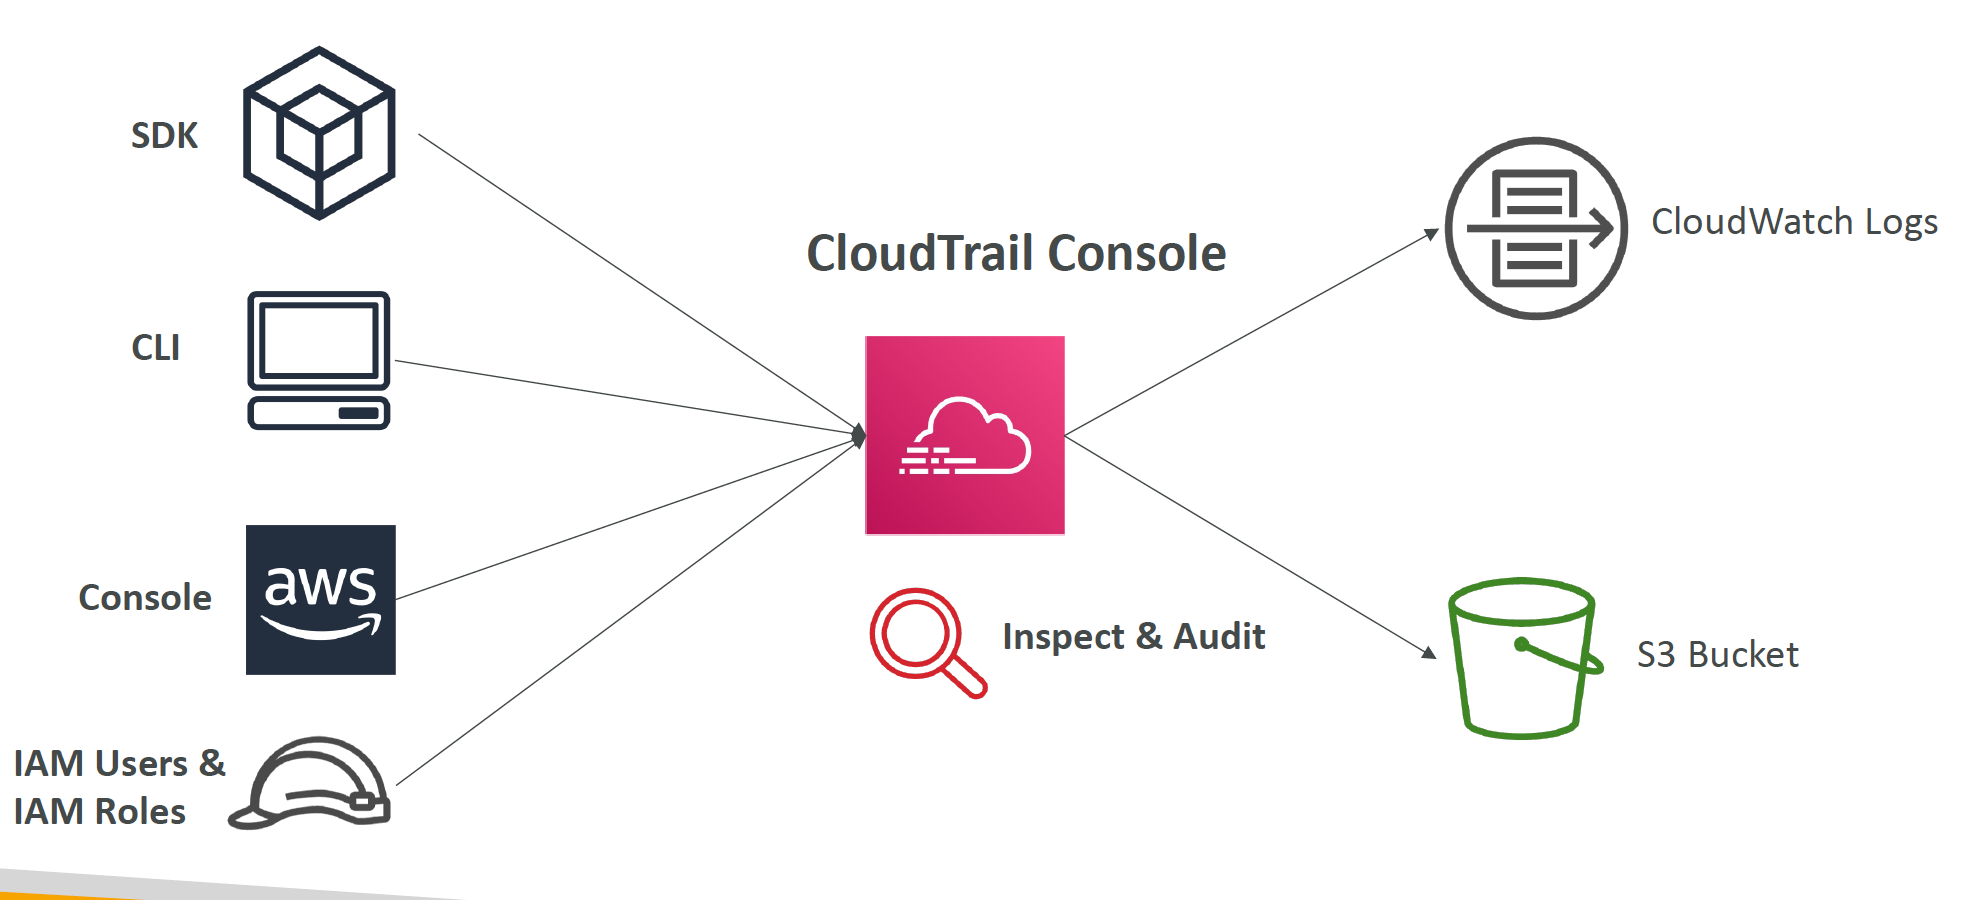
- Provides governance, compliance and audit for your AWS Account. 为您的 AWS 帐户提供治理,合规性和审计。
- CloudTrail is enabled by default!
- Get an history of events / API calls made within your AWS Account by: • Console • SDK • CLI • AWS Services
- Can put logs from CloudTrail into CloudWatch Logs or S3
- A trail can be applied to All Regions (default) or a single Region. 一条小径可以应用于所有区域(默认)或单个区域。
- If a resource is deleted in AWS, investigate CloudTrail first. 如果在 AWS 中删除了资源,请首先调查 CloudTrail。
12.4 AWS X-Ray – Distributed Tracing 分析与调试分布式生产应用程序
- Debugging in Production, the good old way: • Test locally • Add log statements everywhere • Re-deploy in production
- Log formats differ across applications and log analysis is hard. 日志格式在应用程序之间有所不同,日志分析很困难。
- Debugging: one big monolith “easy”, distributed services “hard”
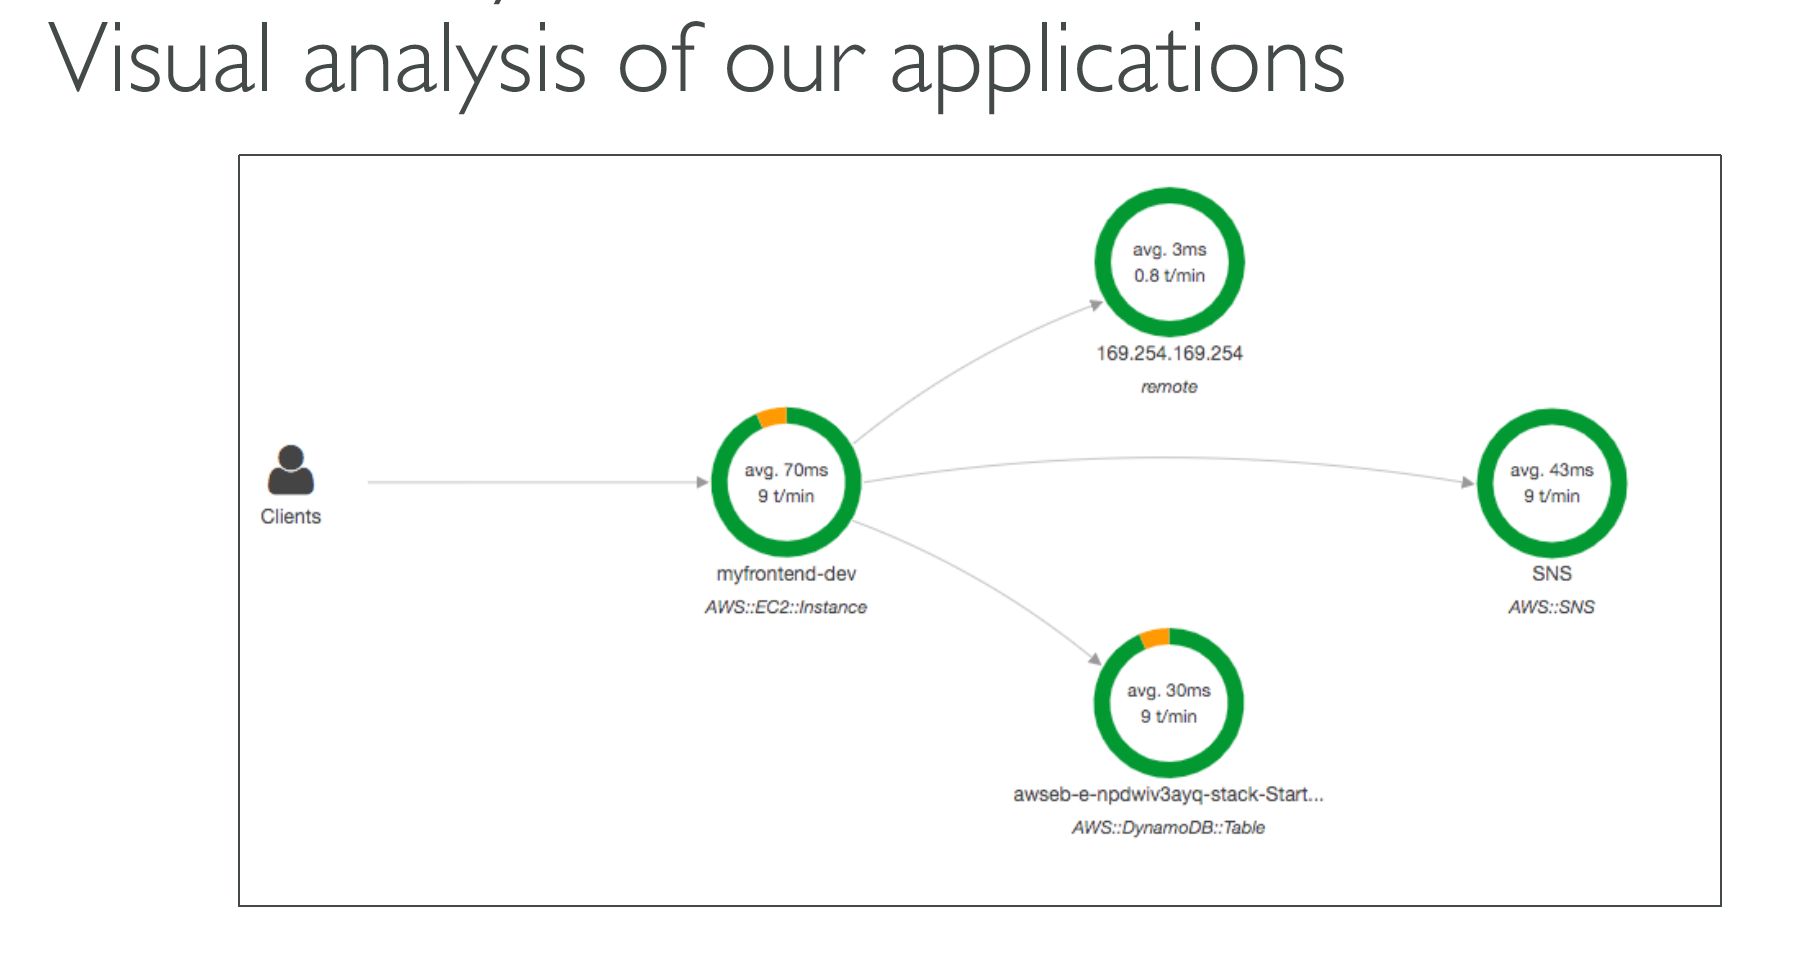
- No common views of your entire architecture
AWS X-Ray advantages
- Troubleshooting performance (bottlenecks)
- Understand dependencies in a microservice architecture. 在微服务架构中了解依赖关系。
- Pinpoint service issues. 确定服务问题。
- Review request behavior. 查看请求行为。
- Find errors and exceptions
- Are we meeting time SLA?
- Where I am throttled? 我在哪里受到限制?
- Identify users that are impacted. 确定影响的用户。
12.5 Amazon CodeGuru – 利用 ML 支持的建议自动执行代码审查并优化应用程序性能
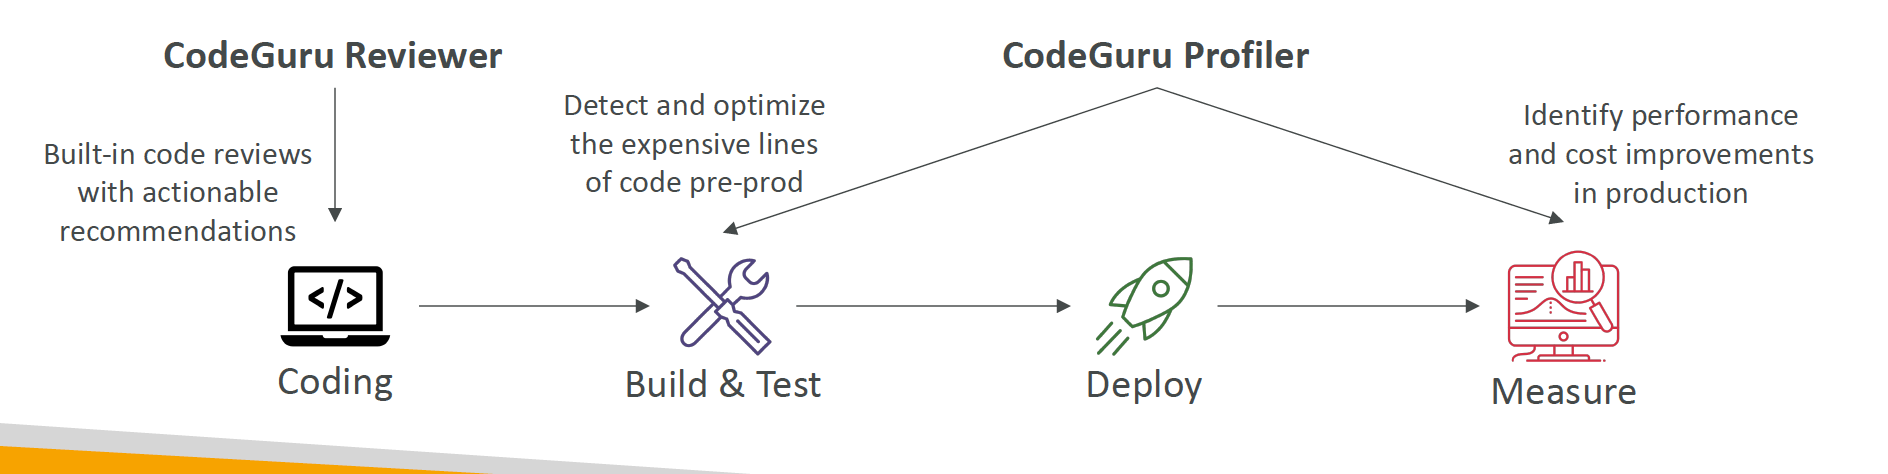
- An ML-powered service for automated code reviews and application performance recommendations. 一个基于 ML 的服务,用于自动执行代码审查和应用程序性能建议。
- Provides two functionalities
- CodeGuru Reviewer: automated code reviews for static code analysis (development). 静态代码分析(开发)的自动化代码审查。
- CodeGuru Profiler: visibility/recommendations about application performance during runtime (production). 在运行时(生产)中可见性/建议应用程序性能。
12.6 AWS Health Dashboard – Service Health Dashboard 服务健康仪表板
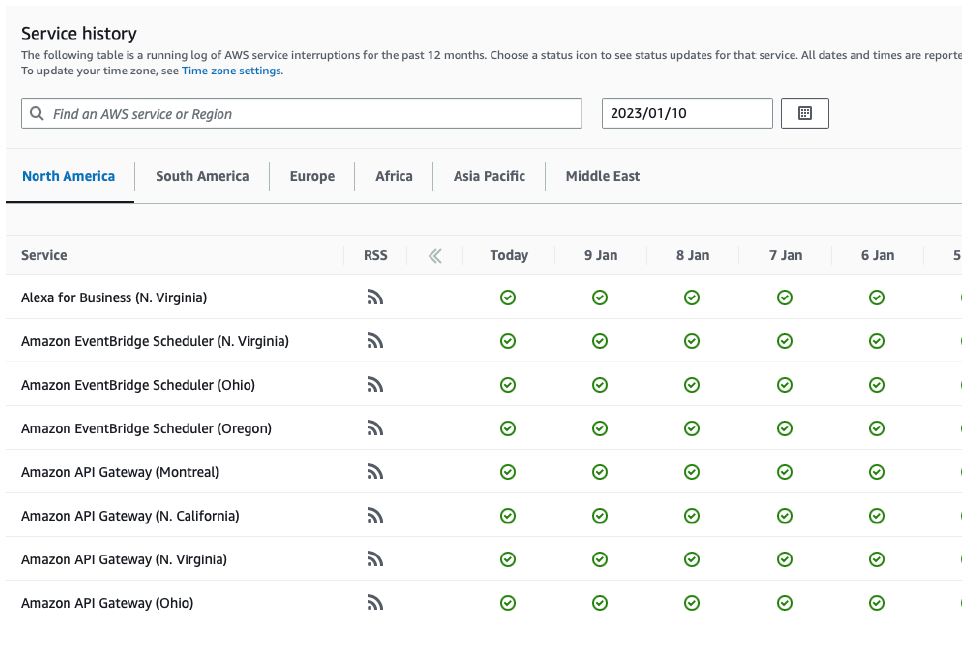
1. Service History
- Shows all regions, all services health. 显示所有区域,所有服务的健康状况。
- Shows historical information for each day. 显示每天的历史信息。
- Has an RSS feed you can subscribe to
- Previously called AWS Service Health Dashboard
2. Your Account
- Previously called AWS Personal Health Dashboard (PHD)
- AWS Account Health Dashboard provides alerts and remediation guidance when AWS is experiencing events that may impact you. AWS 帐户健康仪表板在 AWS 遇到可能影响您的事件时提供警报和修复指南。
- While the Service Health Dashboard displays the general status of AWS services, Account Health Dashboard gives you a personalized view into the performance and availability of the AWS services underlying your AWS resources. 账户健康仪表板为您提供了一个个性化的视图,以查看支持您的 AWS 资源的 AWS 服务的性能和可用性。
- The dashboard displays relevant and timely information to help you manage events in progress and provides proactive notification to help you plan for scheduled activities. 仪表板显示相关且及时的信息,以帮助您管理正在进行的事件,并提供主动通知,以帮助您计划进行的活动。
- Can aggregate data from an entire AWS Organization
12.7 Monitoring Summary
- CloudWatch: • Metrics: monitor the performance of AWS services and billing metrics • Alarms: automate notification, perform EC2 action, notify to SNS based on metric • Logs: collect log files from EC2 instances, servers, Lambda functions… • Events (or EventBridge): react to events in AWS, or trigger a rule on a schedule. 响应 AWS 中的事件,或在计划上触发规则。
- CloudTrail: audit API calls made within your AWS account. CloudTrail can record the history of events/API calls made within you AWS account, which will help determine who or what deleted the resource. CloudTrail 可以记录在您的 AWS 帐户中进行的事件/ API 调用的历史记录,这将有助于确定谁或什么删除了资源。
- CloudTrail Insights: automated analysis of your CloudTrail Events
- X-Ray: trace requests made through your distributed applications. 跟踪通过分布式应用程序进行的请求。
- Service Health Dashboard: status of all AWS services across all regions
- Personal Health Dashboard: AWS events that impact your infrastructure. It provides alerts and remediation guidance when AWS is experiencing events that may impact you. 当 AWS 遇到可能影响您的事件时,它提供警报和修复指南。
- Amazon CodeGuru: automated code reviews and application performance recommendations. 自动化代码审查和应用程序性能建议。
Section 13: VPC & Networking
13.1 VPC & Subnets Primer
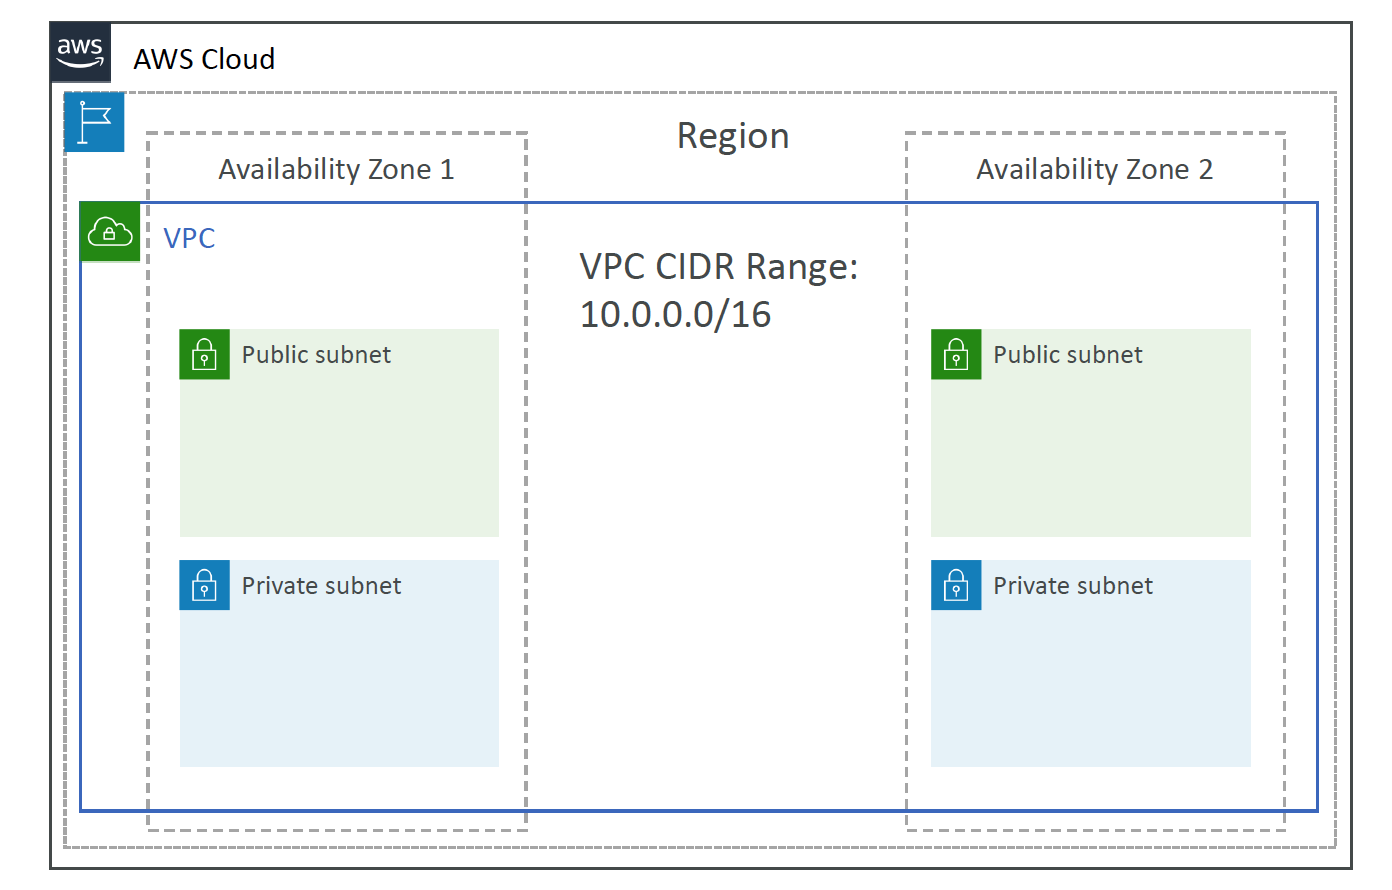
- VPC - Virtual Private Cloud: private network to deploy your resources (regional resource). 部署资源的私有网络(区域资源)。
- Subnets allow you to partition your network inside your VPC (Availability Zone resource). 子网允许您在 VPC 内部分区网络(可用区资源)。
- A public subnet is a subnet that is accessible from the internet. 公共子网是可以从 Internet 访问的子网。
- A private subnet is a subnet that is not accessible from the internet. 私有子网是无法从 Internet 访问的子网
- To define access to the internet and between subnets, we use Route Tables. 要定义对 Internet 和子网之间的访问,我们使用路由表。
13.2 Internet Gateway & NAT Gateways
- Internet Gateways helps our VPC instances connect with the internet. Internet 网关帮助我们的 VPC 实例连接到 Internet。
- Public Subnets have a route to the internet gateway.
- NAT Gateways (AWS-managed) & NAT Instances (self-managed) allow your instances in your Private Subnets to access the internet while remaining private. NAT 网关(AWS 管理)和 NAT 实例(自我管理)允许您在私有子网中的实例访问 Internet,同时保持私有。
13.3 Network ACL & Security Groups
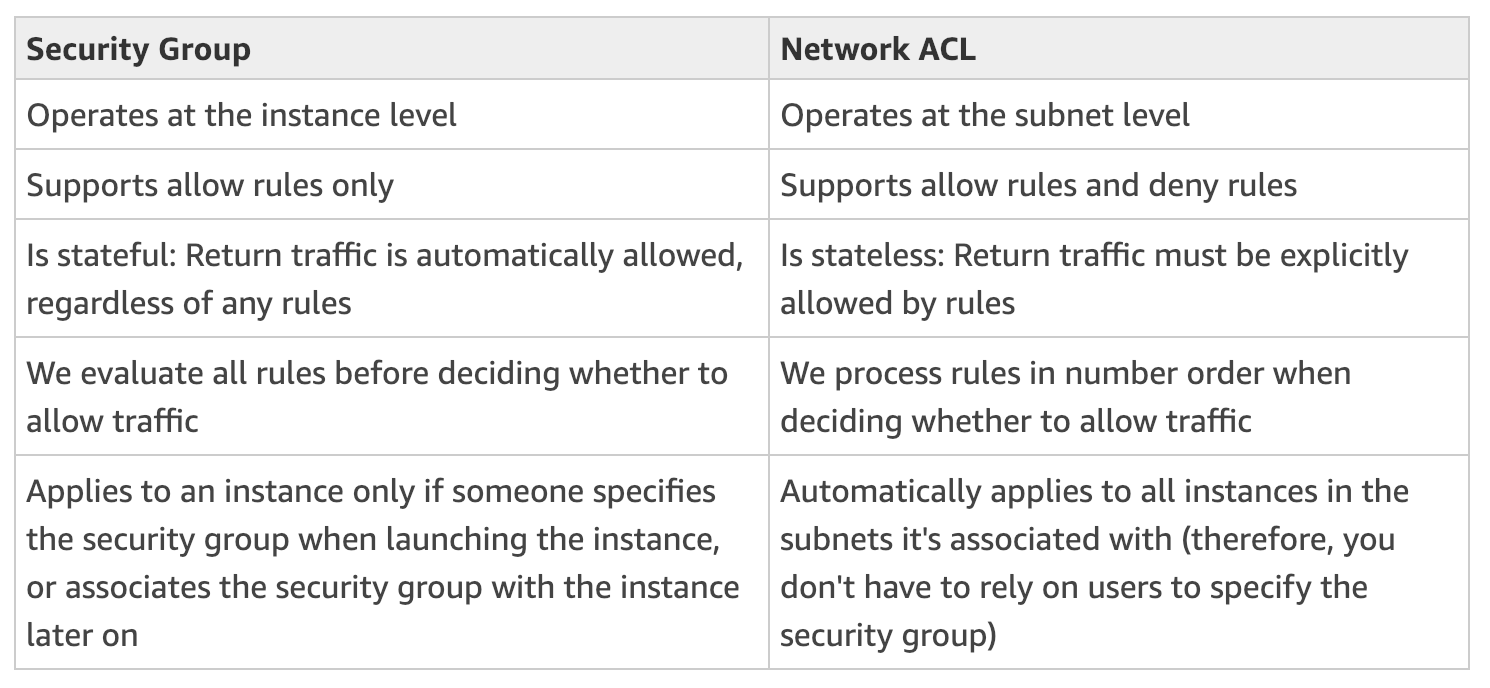
- NACL (Network ACL)
- A firewall which controls traffic from and to subnet. 控制子网的流量的防火墙。
- Can have ALLOW and DENY rules
- Are attached at the Subnet level
- Rules only include IP addresses
- Security Groups
- A firewall that controls traffic to and from an ENI / an EC2 Instance. 控制流量到和从 ENI / EC2 实例的防火墙。
- Can have only ALLOW rules
- Rules include IP addresses and other security groups
13.4 VPC Flow Logs - Monitoring Network Traffic
- Capture information about IP traffic going into your interfaces:
- 捕获有关进入接口的 IP 流量的信息
- VPC Flow Logs
- Subnet Flow Logs
- Elastic Network Interface Flow Logs
- Helps to monitor & troubleshoot connectivity issues. Example:
- 帮助监控和解决连接问题
- Subnets to internet
- Subnets to subnets
- Internet to subnets
- Captures network information from AWS managed interfaces too: Elastic Load Balancers, ElastiCache, RDS, Aurora, etc….
- VPC Flow logs data can go to S3 / CloudWatch Logs
13.5 VPC Peering - Connect Two VPCs Privately
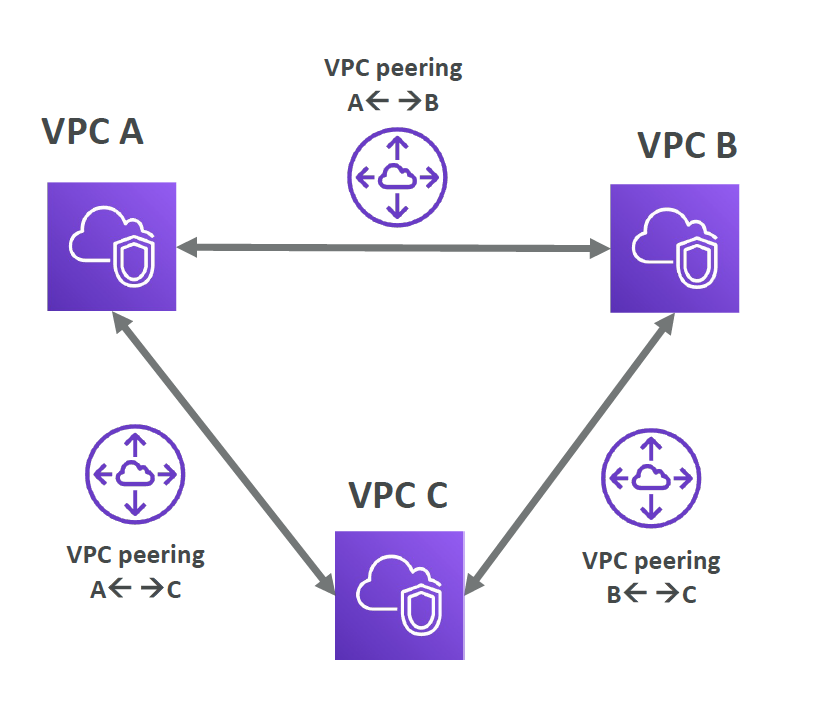
- Connect two VPC, privately using AWS’ network. 使用 AWS 的网络私下连接两个 VPC。
- Make them behave as if they were in the same network. 使它们的行为就像它们在同一网络中一样。
- Must not have overlapping CIDR (IP address range)
- VPC Peering connection is not transitive (must be established for each VPC that need to communicate with one another)
13.6 VPC Endpoints - Private Access to AWS Services
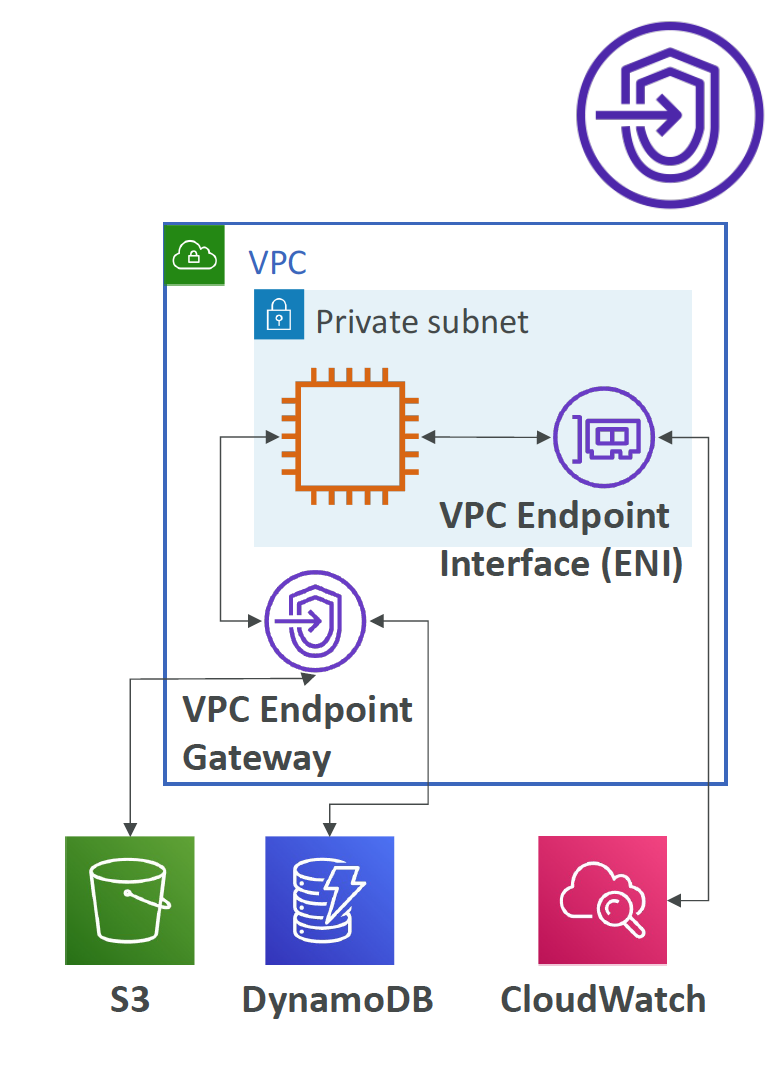
- Endpoints allow you to connect to AWS Services using a private networkinstead of the public www network. 端点允许您使用私有网络而不是公共 www 网络连接到 AWS 服务。
- This gives you enhanced security and lower latency to access AWS services. 这为您提供了增强的安全性和更低的延迟访问 AWS 服务。
- VPC Endpoint Gateway: S3 & DynamoDB
- VPC Endpoint Interface: the rest
13.7 Site to Site VPN & Direct Connect - Connect On-Premises to AWS
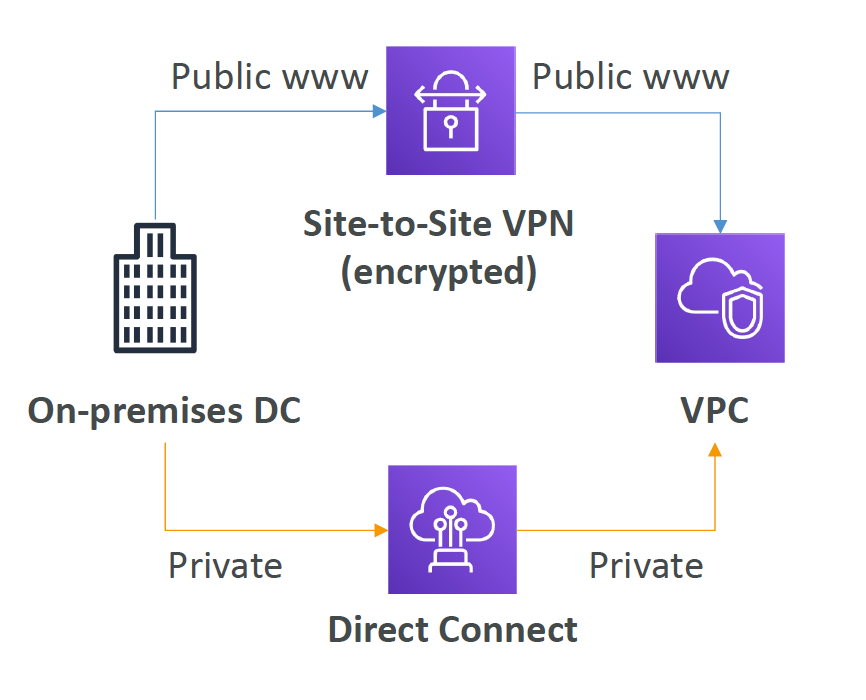
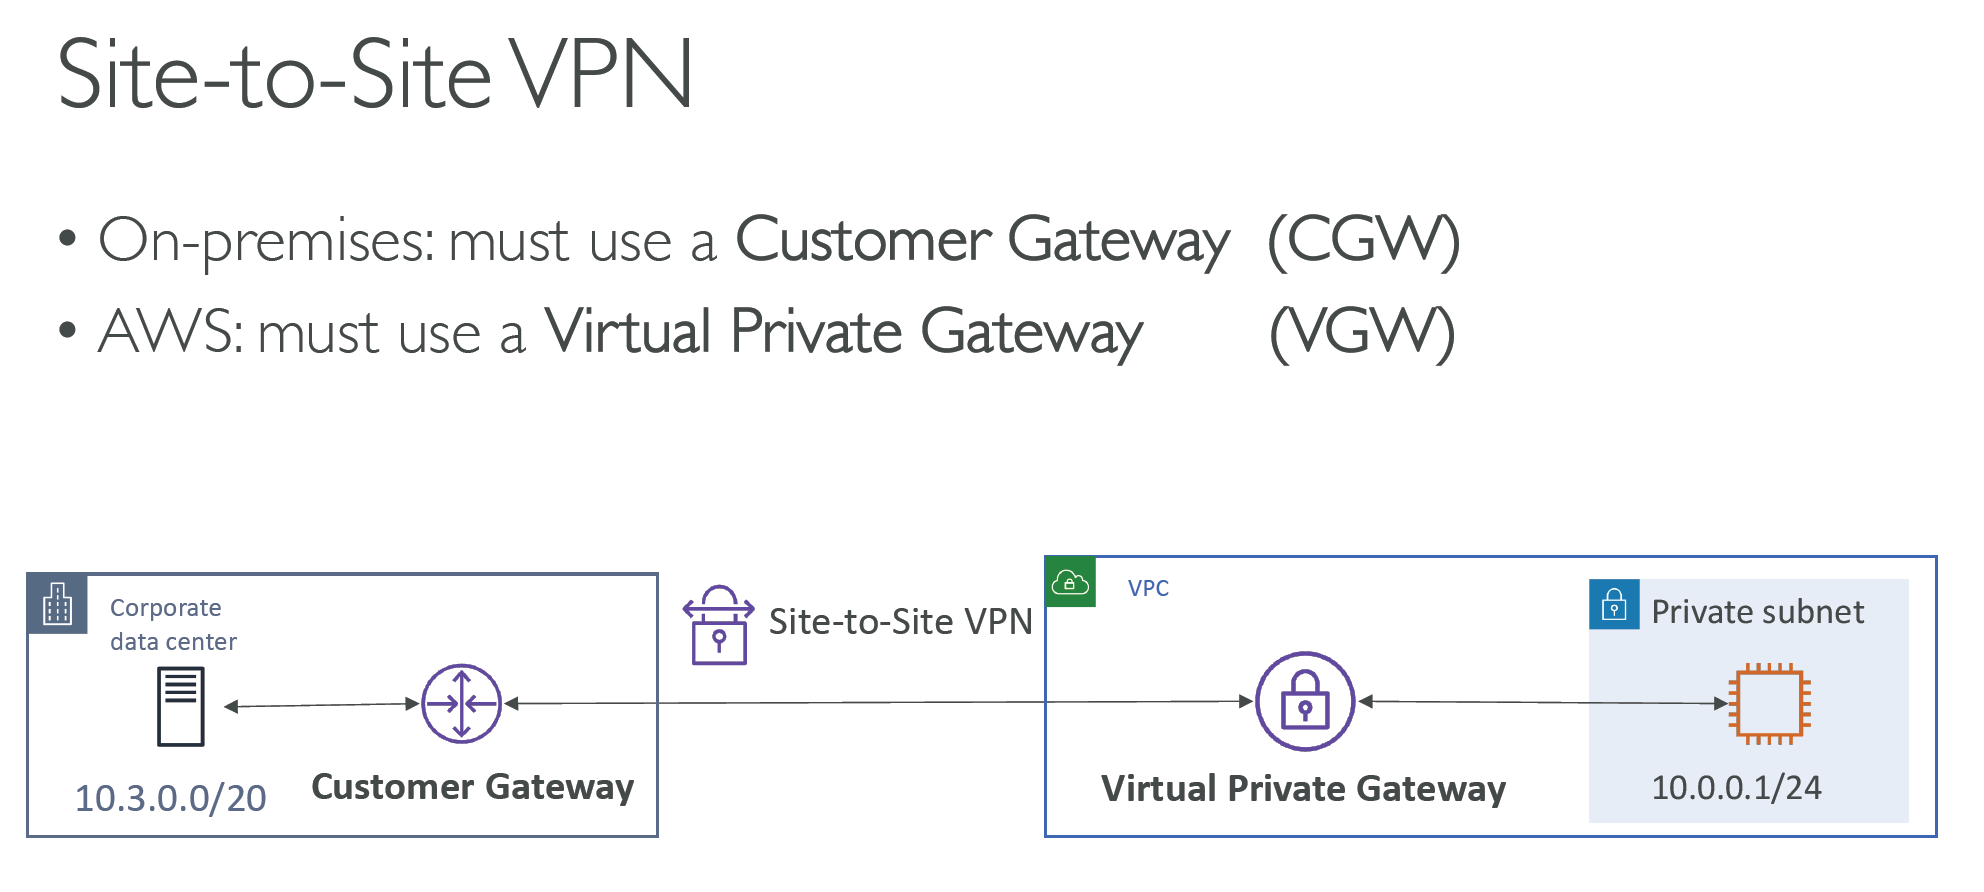
- Site to Site VPN
- Connect an on-premises VPN to AWS. 连接本地 VPN 到 AWS。
- The connection is automatically encrypted
- Goes over the public internet
- Direct Connect (DX)
- Establish a physical connection between on-premises and AWS. 在本地和 AWS 之间建立物理连接。
- The connection is private, secure and fast
- Goes over a private network
- Takes at least a month to establish
13.8 Transit Gateway - Connect Thousands of VPCs
- For having transitive peering between thousands of VPC and on-premises, hub-and-spoke (star) connection. 为了在数千个 VPC 和本地之间建立传递性对等连接,集线器和辐射连接。
- One single Gateway to provide this functionality. 一个单一的网关来提供这个功能。
- Works with Direct Connect Gateway, VPN connections
13.9 VPC Closing Comments
- VPC: Virtual Private Cloud
- Subnets: Tied to an AZ, network partition of the VPC. 与 AZ 绑定,VPC 的网络分区。
- Internet Gateway: at the VPC level, provide Internet Access
- NAT Gateway / Instances: give internet access to private subnets
- NACL: Stateless, subnet rules for inbound and outbound
- Security Groups: Stateful, operate at the EC2 instance level or ENI
- VPC Peering: Connect two VPC with non overlapping IP ranges, nontransitive. 连接两个 VPC,IP 范围不重叠,非传递。
- VPC Endpoints: Provide private access to AWS Services within VPC. 在 VPC 中提供对 AWS 服务的私有访问。
- PrivateLink: Privately connect to a service in a 3rd party VPC
- VPC Flow Logs: network traffic logs
- Site to Site VPN: VPN over public internet between on-premises DC and AWS
- Client VPN: OpenVPN connection from your computer into your VPC
- Direct Connect: direct private connection to AWS
- Transit Gateway: Connect thousands of VPC and on-premises networks together. 连接数千个 VPC 和本地数据中心网络。
Section 14: Security & Compliance 安全与合规
14.1 DDOS Protection on AWS
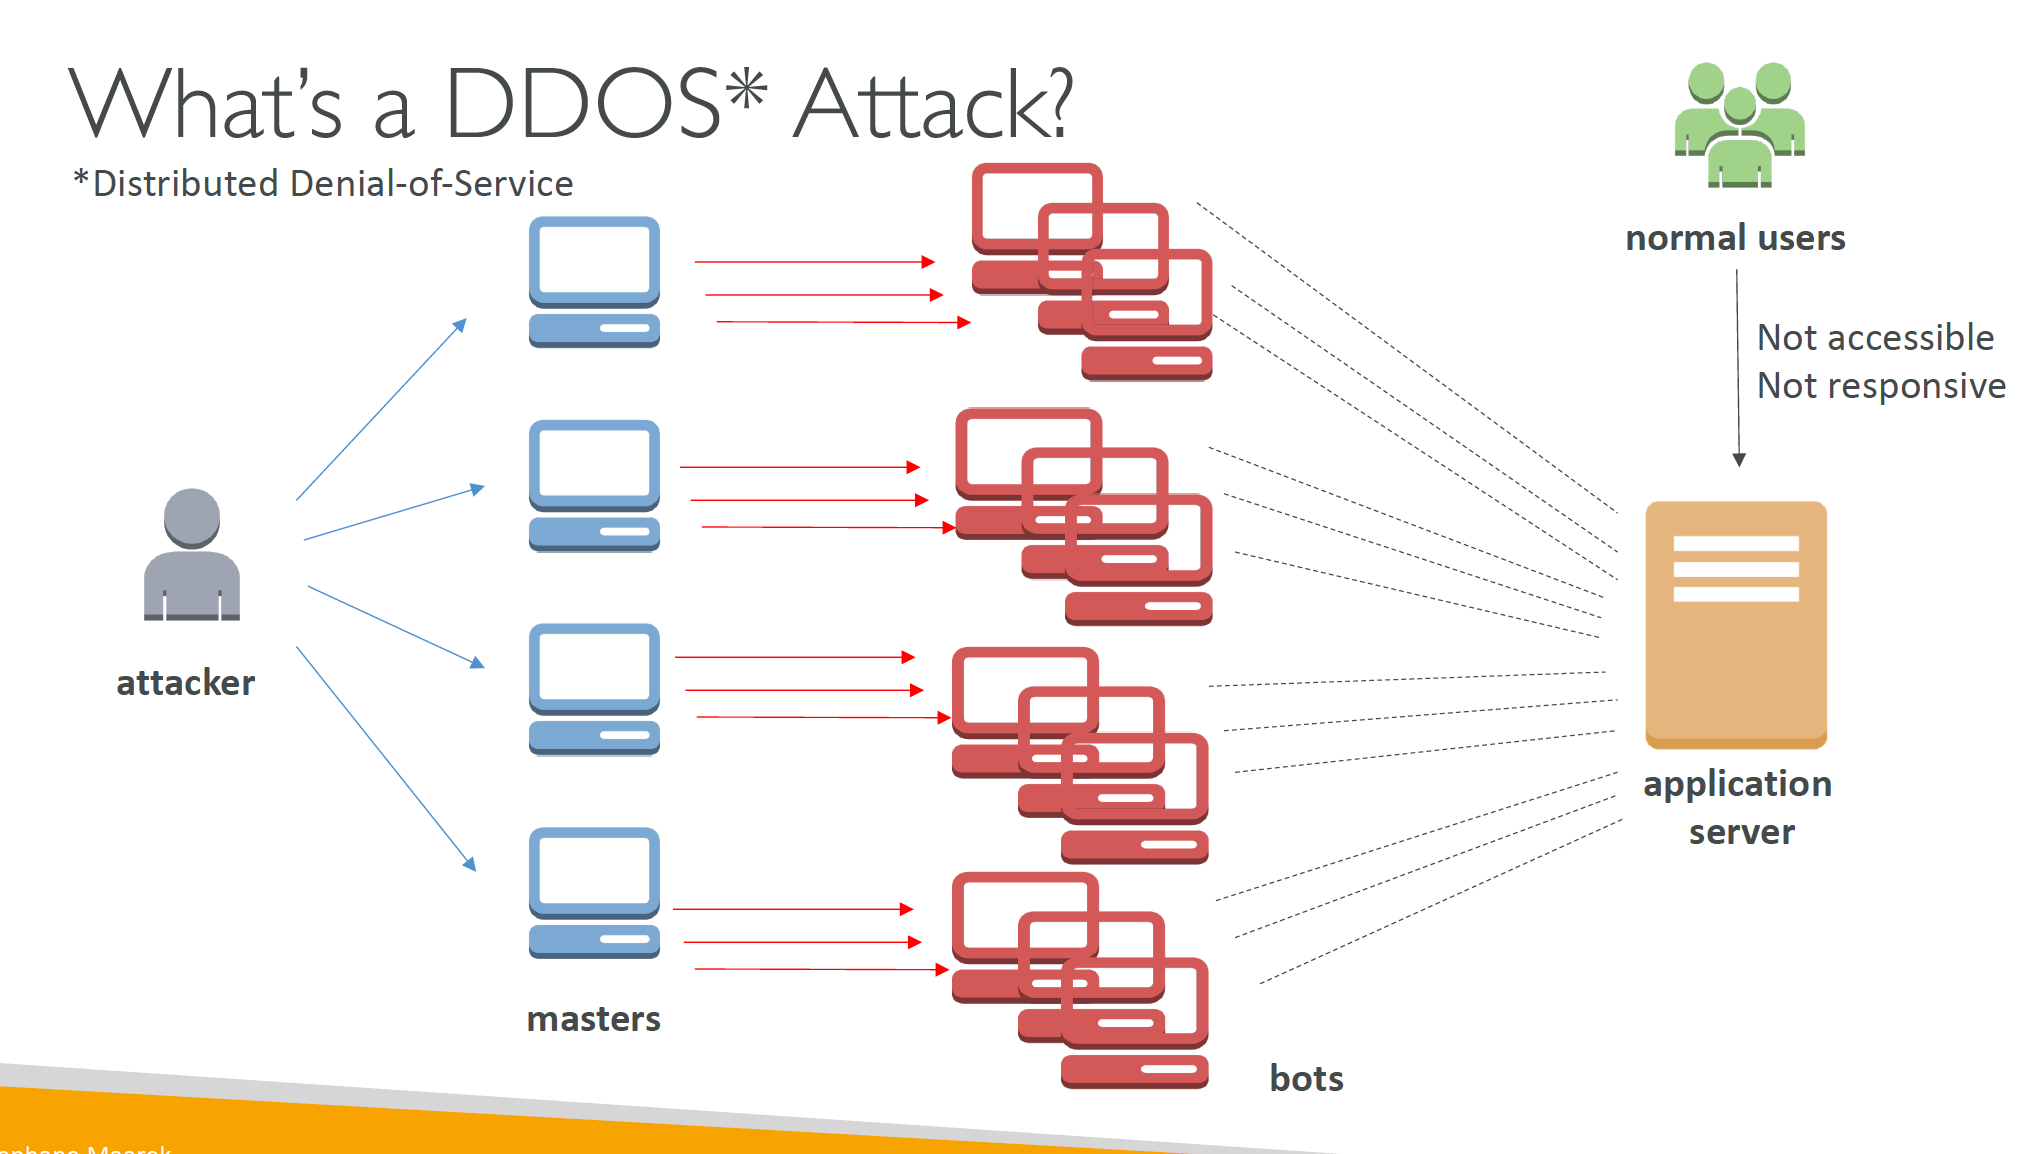
- AWS Shield Standard: protects against DDOS attack for your website and applications, for all customers at no additional costs. 保护您的网站和应用程序免受 DDOS 攻击,所有客户免费。
- AWS Shield Advanced: 24/7 premium DDoS protection
- AWS WAF: Filter specific requests based on rules
- CloudFront and Route 53: • Availability protection using global edge network • Combined with AWS Shield, provides attack mitigation at the edge • Be ready to scale – leverage AWS Auto Scaling
14.2 AWS Shield
- AWS Shield Standard:
- Free service that is activated for every AWS customer. 每个 AWS 客户都可以免费使用。
- Provides protection from attacks such as SYN/UDP Floods, Reflection attacks and other layer 3/layer 4 attacks. 提供来自 SYN/UDP Floods,反射攻击和其他第 3 层/第 4 层攻击的保护。
- AWS Shield Advanced:
- Optional DDoS mitigation service ($3,000 per month per organization)
- Protect against more sophisticated attack on Amazon EC2, Elastic Load Balancing (ELB), Amazon CloudFront, AWS Global Accelerator, and Route 53
- 24/7 access to AWS DDoS response team (DRP)
- Protect against higher fees during usage spikes due to DDoS.
14.3 AWS WAF – Web Application Firewall
- Protects your web applications from common web exploits (Layer 7). 保护您的 Web 应用程序免受常见的 Web 漏洞攻击(第 7 层)。
- Layer 7 is HTTP (vs Layer 4 is TCP)
- Deploy on Application Load Balancer, API Gateway, CloudFront
- Define Web ACL (Web Access Control List):
- Rules can include IP addresses, HTTP headers, HTTP body, or URI strings. 规则可以包括 IP 地址,HTTP 头,HTTP 正文或 URI 字符串。
- Protects from common attack - SQL injection and Cross-Site Scripting (XSS). 保护您的 Web 应用程序免受常见的 Web 漏洞攻击(第 7 层)。
- Size constraints, geo-match (block countries). 尺寸约束,地理匹配(阻止国家)。
- Rate-based rules (to count occurrences of events) – for DDoS protection. 基于速率的规则(用于计算事件发生的次数) - 用于 DDoS 防护。
14.4 Data at rest vs. Data in transit
- At rest: data stored or archived on a device. 在设备上存储或存档的数据。
- On a hard disk, on a RDS instance, in S3 Glacier Deep Archive, etc.
- In transit (in motion): data being moved from one location to another. 从一个地方移动到另一个地方的数据。
- Transfer from on-premises to AWS, EC2 to DynamoDB, etc.
- Means data transferred on the network. 意味着通过网络传输的数据。
- We want to encrypt data in both states to protect it!
- For this we leverage encryption keys
14.5 AWS KMS - Key Management Service
- Anytime you hear “encryption” for an AWS service, it’s most likely KMS. 每当您听到 AWS 服务的“加密”时,它很可能是 KMS。
- KMS = AWS manages the encryption keys for us. KMS = AWS 为我们管理加密密钥。
- Encryption Opt-in: • EBS volumes: encrypt volumes • S3 buckets: Server-side encryption of objects • Redshift database: encryption of data • RDS database: encryption of data • EFS drives: encryption of data
- Encryption Automatically enabled: • CloudTrail Logs • S3 Glacier • Storage Gateway
14.6 CloudHSM - Hardware Security Module 硬件安全模块
- KMS => AWS manages the software for encryption. KMS => AWS 管理加密软件。
- CloudHSM => AWS provisions encryption hardware
- Dedicated Hardware (HSM = Hardware Security Module)
- You manage your own encryption keys entirely (not AWS)
- HSM device is tamper resistant, FIPS 140-2 Level 3 compliance
14.7 AWS Certificate Manager (ACM)
- Let’s you easily provision, manage, and deploy SSL/TLS Certificates. 让您可以轻松地提供,管理和部署 SSL/TLS 证书。
- Used to provide in-flight encryption for websites (HTTPS). 用于为网站(HTTPS)提供传输加密。
- Supports both public and private TLS certificates
- Free of charge for public TLS certificates
- Automatic TLS certificate renewal
- Integrations with (load TLS certificates on)
- Elastic Load Balancers
- CloudFront Distributions
- APIs on API Gateway
14.8 AWS Secrets Manager
- Newer service, meant for storing secrets. 新服务,用于存储密码。
- Capability to force rotation of secrets every X days
- Automate generation of secrets on rotation (uses Lambda)
- Integration with Amazon RDS (MySQL, PostgreSQL, Aurora)
- Secrets are encrypted using KMS
- Mostly meant for RDS integration
14.9 Amazon GuardDuty – Threat Detection
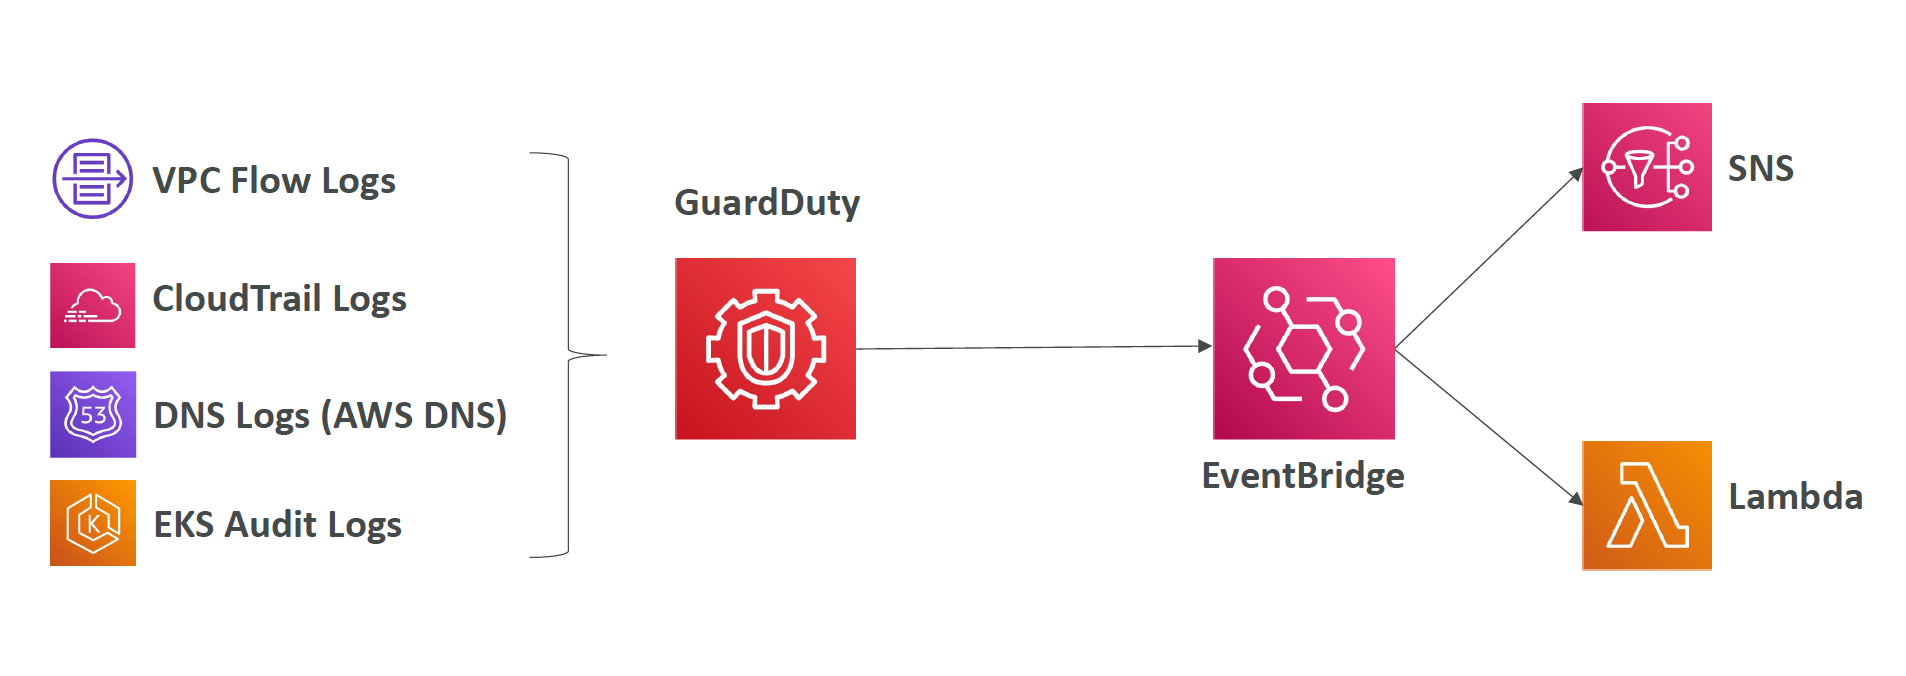
- Intelligent Threat discovery to protect your AWS Account. 智能威胁发现以保护您的 AWS 帐户。
- Uses Machine Learning algorithms, anomaly detection, 3rd party data
- One click to enable (30 days trial), no need to install software
- Input data includes:
- CloudTrail Events Logs – unusual API calls, unauthorized deployments
- CloudTrail Management Events – create VPC subnet, create trail, …
- CloudTrail S3 Data Events – get object, list objects, delete object, …
- VPC Flow Logs – unusual internal traffic, unusual IP address
- DNS Logs – compromised EC2 instances sending encoded data within DNS queries
- Kubernetes Audit Logs – suspicious activities and potential EKS cluster compromises
- CloudTrail Events Logs – unusual API calls, unauthorized deployments
- Can setup EventBridge rules to be notified in case of findings
- EventBridge rules can target AWS Lambda or SNS
- Can protect against CryptoCurrency attacks (has a dedicated “finding” for it). 可以防止加密货币攻击(有专门的“发现”)。
14.10 Amazon Inspector – Automated Security Assessment 自动安全评估
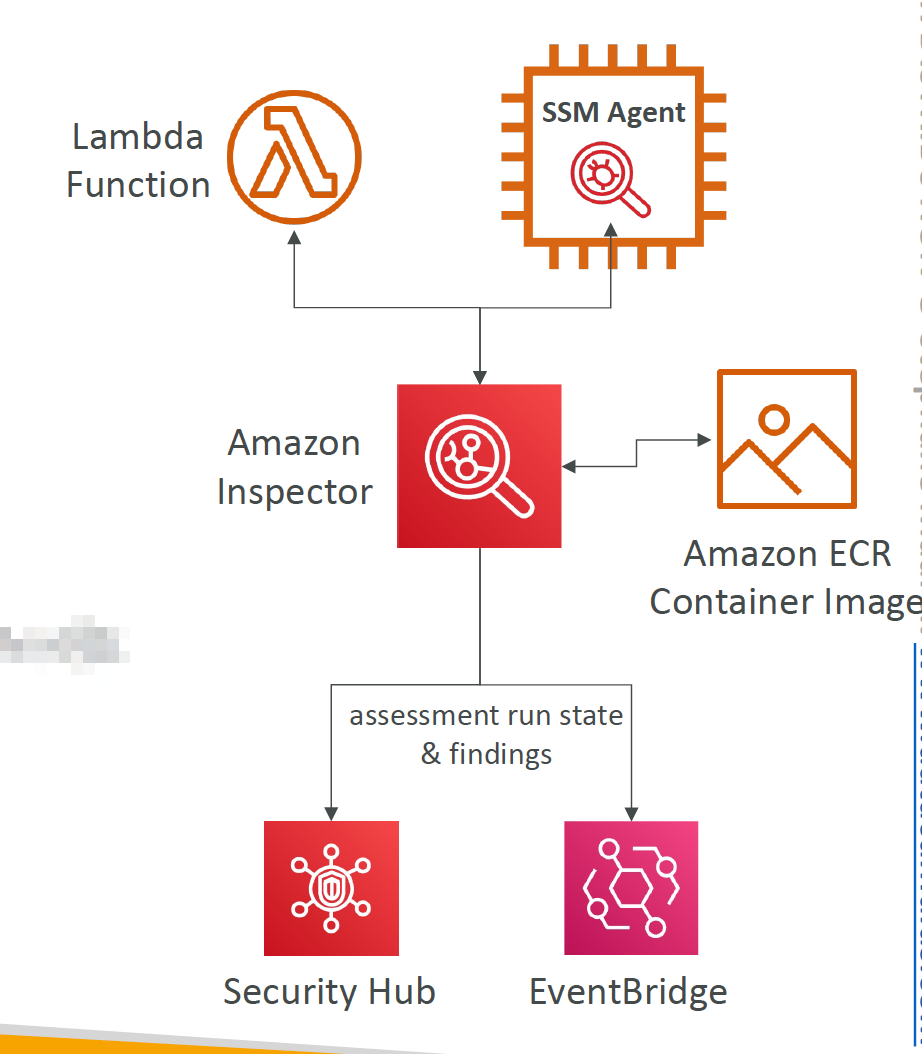
- Automated Security Assessments. 自动安全评估。
- For EC2 instances
- Leveraging the AWS System Manager (SSM) agent
- Analyze against unintended network accessibility
- Analyze the running OS against known vulnerabilities
- For Container Images push to Amazon ECR
- Assessment of Container Images as they are pushed
- For Lambda Functions
- Identifies software vulnerabilities in function code and package dependencies. 识别函数代码和软件包依赖项中的软件漏洞。
- Assessment of functions as they are deployed
- Reporting & integration with AWS Security Hub. 报告和与 AWS 安全中心的集成。
- Send findings to Amazon Event Bridge. 将发现发送到 Amazon 事件桥。
14.11 AWS Config – Configuration Management 配置管理
- Helps with auditing and recording compliance of your AWS resources. 帮助您审计和记录 AWS 资源的合规性。
- Helps record configurations and changes over time. 帮助记录配置和时间的变化。
- Possibility of storing the configuration data into S3 (analyzed by Athena)
- Questions that can be solved by AWS Config:
- Is there unrestricted SSH access to my security groups?
- Do my buckets have any public access?
- How has my ALB configuration changed over time?
- You can receive alerts (SNS notifications) for any changes
- AWS Config is a per-region service
- Can be aggregated across regions and accounts
14.12 AWS Macie – Data Security & Privacy 数据安全和隐私
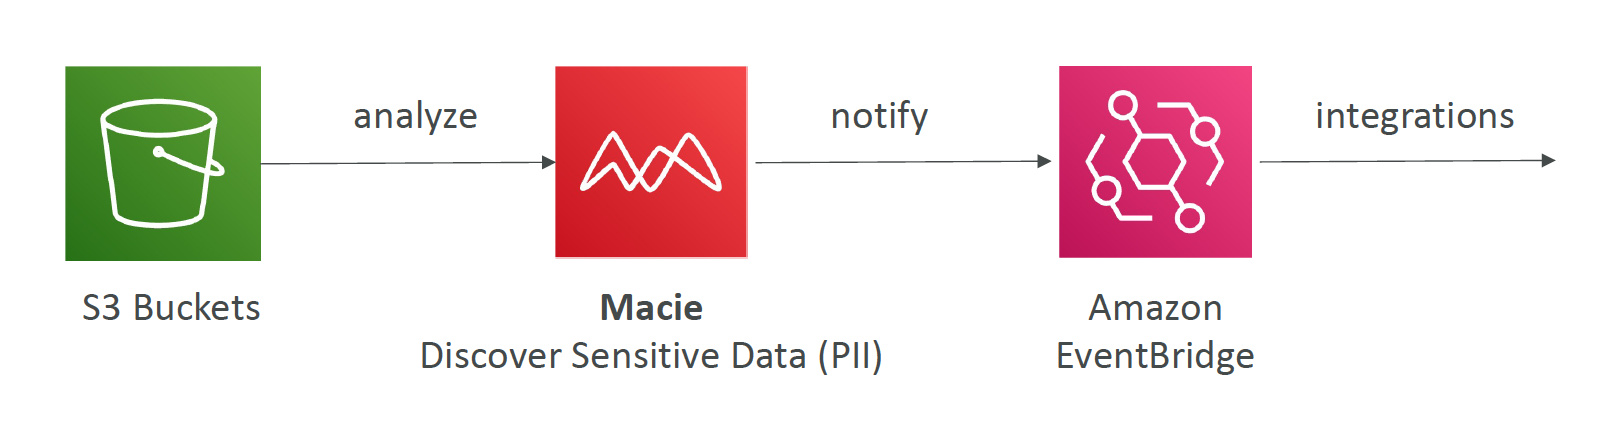
- Amazon Macie is a fully managed data security and data privacy service that uses machine learning and pattern matching to discover and protect your sensitive data in AWS. Amazon Macie 是一项完全托管的数据安全和数据隐私服务,它使用机器学习和模式匹配来发现和保护您在 AWS 中的敏感数据。
- Macie helps identify and alert you to sensitive data, such as personally identifiable information (PII). Macie 帮助您识别和提醒您敏感数据,例如个人身份信息(PII)。
14.13 AWS Security Hub – Central Security Tool 中央安全工具
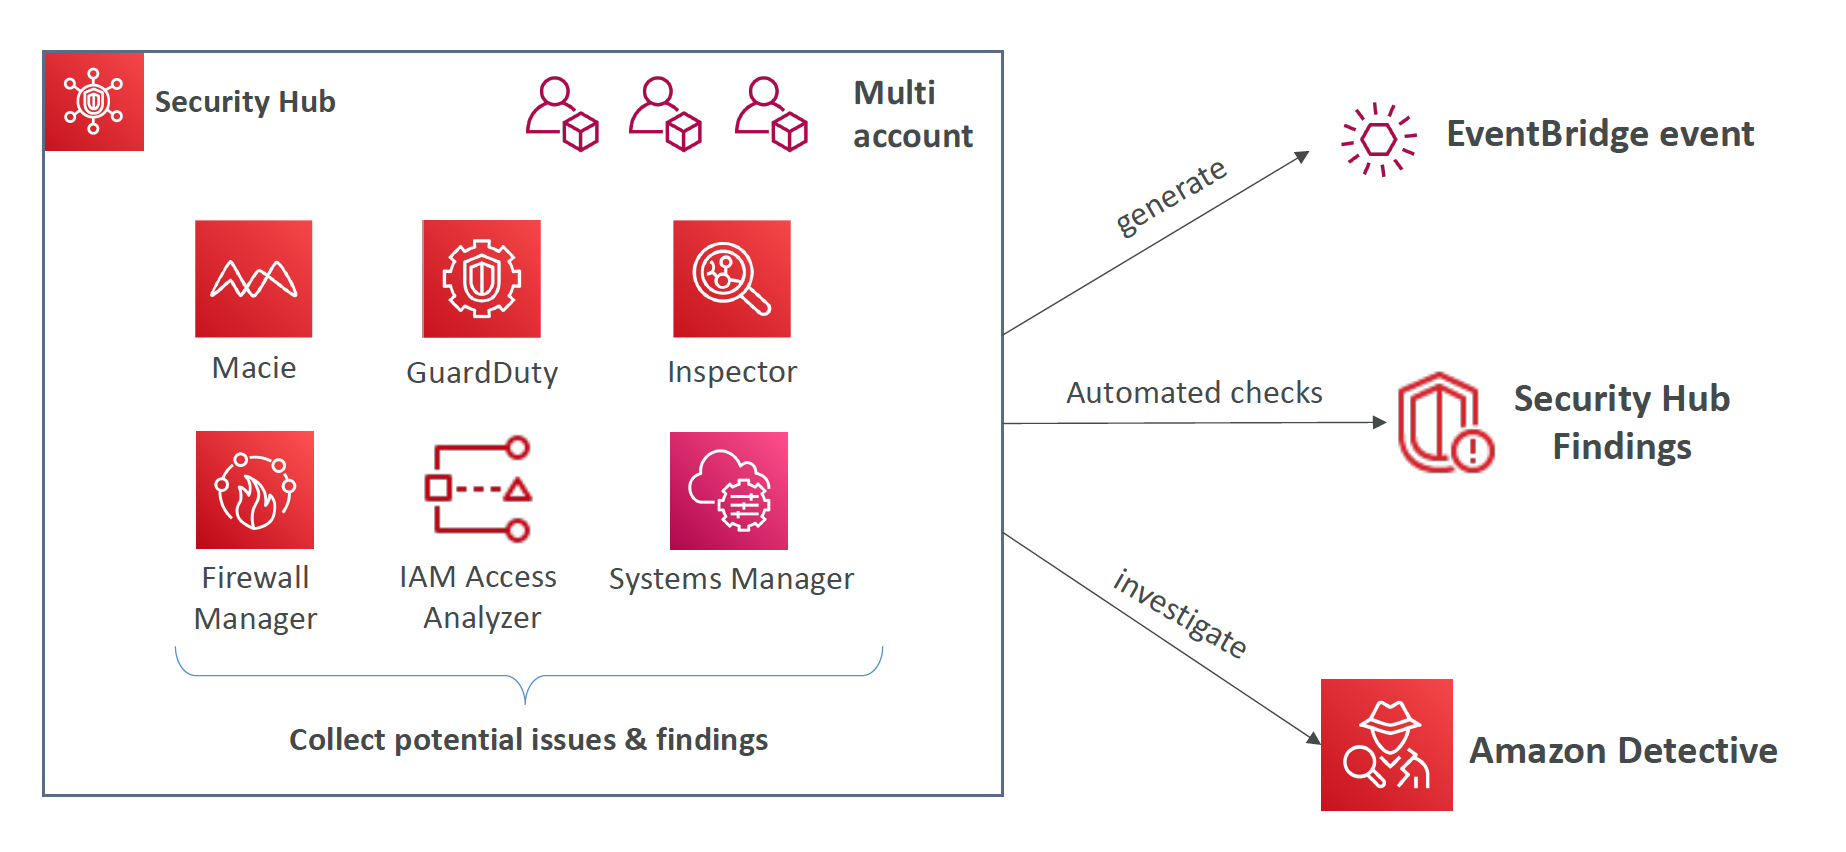
- Central security tool to manage security across several AWS accounts and automate security checks. 中央安全工具,用于管理多个 AWS 帐户之间的安全性并自动执行安全检查。
- Integrated dashboards showing current security and compliance status to quickly take actions. 集成的仪表板显示当前的安全性和合规性状态,以便快速采取行动。
- Automatically aggregates alerts in predefined or personal findings formats from various AWS services & AWS partner tools:
- GuardDuty
- Inspector
- Macie
- IAM Access Analyzer
- AWS Systems Manager
- AWS Firewall Manager
- AWS Partner Network Solutions
- Must first enable the AWS Config Service
14.14 Amazon Detective – Root Cause Analysis 根本原因分析
- GuardDuty, Macie, and Security Hub are used to identify potential security issues, or findings
- Sometimes security findings require deeper analysis to isolate the root cause and take action – it’s a complex process. 有时安全发现需要更深入的分析来隔离根本原因并采取行动 - 这是一个复杂的过程。
- Amazon Detective analyzes, investigates, and quickly identifies the root cause of security issues or suspicious activities (using ML and graphs). Amazon Detective 分析,调查和快速识别安全问题或可疑活动的根本原因(使用 ML 和图形)。
- Automatically collects and processes events from VPC Flow Logs, CloudTrail, GuardDuty and create a unified view. 自动收集和处理来自 VPC 流日志,CloudTrail,GuardDuty 的事件并创建统一视图。
- Produces visualizations with details and context to get to the root cause
14.15 AWS Abuse – Report Abuse & Illegal Activities 举报滥用和非法活动
- Report suspected AWS resources used for abusive or illegal purposes. 报告可疑的 AWS 资源用于滥用或非法用途。
- Abusive & prohibited behaviors are:
- Spam – receving undesired emails from AWS-owned IP address, websites & forums spammed by AWS resources. 垃圾邮件 - 从 AWS 所有 IP 地址,网站和论坛收到不需要的电子邮件。
- Port scanning – sending packets to your ports to discover the unsecured ones. 端口扫描 - 向您的端口发送数据包以发现未加密的端口。
- DoS or DDoS attacks – AWS-owned IP addresses attempting to overwhlem or crash your servers/softwares. DoS 或 DDoS 攻击 - AWS 所有 IP 地址尝试使您的服务器/软件过载或崩溃。
- Intrusion attempts – logging in on your resources. 入侵尝试 - 登录您的资源。
- Hosting objectionable or copyrighted content – distributing illegal or copyrighted content without consent. 托管令人反感或版权内容 - 分发未经许可的非法或版权内容。
- Distributing malware – AWS resources distributing softwares to harm computers or machines. 分发恶意软件 - AWS 资源分发软件以损害计算机或机器。
- Contact the AWS Abuse team:
AWS abuse form, orabuse@amazonaws.com
14.16 Root user privileges 根用户权限
- Root user = Account Owner (created when the account is created)
- Has complete access to all AWS services and resources
- Lock away your AWS account root user access keys!. 锁定您的 AWS 帐户根用户访问密钥!
- Do not use the root account for everyday tasks, even administrative tasks
- Actions that can be performed only by the root user:
- Change account settings (account name, email address, root user password, root user access keys)
- View certain tax invoices
- Close your AWS account
- Restore IAM user permissions
- Change or cancel your AWS Support plan
- Register as a seller in the Reserved Instance Marketplace
- Configure an Amazon S3 bucket to enable MFA
- Edit or delete an Amazon S3 bucket policy that includes an invalid VPC ID or VPC endpoint ID
- Sign up for GovCloud
14.17 AWS Artifact - 合规性文档和协议
- Portal that provides customers with on-demand access to AWS compliance documentation and AWS agreements. 为客户提供即时访问 AWS 合规性文档和 AWS 协议的门户。
- Artifact Reports - Allows you to download AWS security and compliance documents from third-party auditors, like AWS ISO certifications, Payment Card Industry (PCI), and System and Organization Control (SOC) reports
- Artifact Agreements - Allows you to review, accept, and track the status of AWS agreements such as the Business Associate Addendum (BAA) or the Health Insurance Portability and Accountability Act (HIPAA) for an individual account or in your organization
- Can be used to support internal audit or compliance. 可用于支持内部审计或合规性。
14.18 Section Summary: Security & Compliance
- Shared Responsibility on AWS
- Shield: Automatic DDoS Protection + 24/7 support for advanced
- WAF: Firewall to filter incoming requests based on rules. 基于规则过滤传入请求的防火墙。
- KMS: Encryption keys managed by AWS
- CloudHSM: Hardware encryption, we manage encryption keys. 硬件加密,我们管理加密密钥。
- AWS Certificate Manager: provision, manage, and deploy SSL/TLS Certificates. 提供,管理和部署 SSL/TLS 证书。
- Artifact: Get access to compliance reports such as PCI, ISO, etc…
- GuardDuty: Find malicious behavior with VPC, DNS & CloudTrail Logs. 通过 VPC,DNS 和 CloudTrail 日志发现恶意行为。
- Inspector: find software vulnerabilities in EC2, ECR Images, and Lambda functions. 在 EC2,ECR 图像和 Lambda 函数中查找软件漏洞。
- Config: Track config changes and compliance against rules. 跟踪配置更改和规则的合规性。
- Macie: Find sensitive data (ex: PII data) in Amazon S3 buckets. 在 Amazon S3 桶中查找敏感数据(例如:PII 数据)。
- CloudTrail: Track API calls made by users within account
- AWS Security Hub: gather security findings from multiple AWS accounts. 从多个 AWS 帐户收集安全发现。
- Amazon Detective: find the root cause of security issues or suspicious activities. 查找安全问题或可疑活动的根本原因。
- AWS Abuse: Report AWS resources used for abusive or illegal purposes. 报告用于滥用或非法用途的 AWS 资源。
- Root user privileges:
- Change account settings
- Close your AWS account
- Change or cancel your AWS Support plan
- Register as a seller in the Reserved Instance Marketplace
Section 15: Machine Learning
15.1 Amazon Rekognition
- Find objects, people, text, scenes in images and videos using ML. 使用 ML 在图像和视频中查找对象,人员,文本和场景。
- Facial analysis and facial search to do user verification, people counting. 人脸分析和人脸搜索以进行用户验证,人员计数。
- Create a database of “familiar faces” or compare against celebrities
- Use cases:
- Labeling
- Content Moderation
- Text Detection
- Face Detection and Analysis (gender, age range, emotions…)
- Face Search and Verification
- Celebrity Recognition
- Pathing (ex: for sports game analysis)
15.2 Amazon Transcribe
- Automatically convert speech to text. 自动将语音转换为文本。
- Uses a deep learning process called automatic speech recognition (ASR) to convert speech to text quickly and accurately
- Automatically remove Personally Identifiable Information (PII) using Redaction. 使用 Redaction 自动删除个人身份信息(PII)。
- Supports Automatic Language Identification for multi-lingual audio. 支持多语言音频的自动语言识别。
- Use cases:
- transcribe customer service calls
- automate closed captioning and subtitling
- generate metadata for media assets to create a fully searchable archive
15.3 Amazon Lex & Connect

- Amazon Lex: (same technology that powers Alexa)
- Automatic Speech Recognition (ASR) to convert speech to text. 自动语音识别(ASR)将语音转换为文本。
- Natural Language Understanding to recognize the intent of text, callers
- Helps build chatbots, call center bots
- Amazon Connect:
- Receive calls, create contact flows, cloud-based virtual contact center. 接听电话,创建联系流,云端虚拟联系中心。
- Can integrate with other CRM systems or AWS
- No upfront payments, 80% cheaper than traditional contact center solutions. 没有预付款,比传统联系中心解决方案便宜 80%。
15.4 Amazon Comprehend
- For Natural Language Processing – NLP
- Fully managed and serverless service
- Uses machine learning to find insights and relationships in text. 使用机器学习在文本中找到见解和关系。
- Language of the text
- Extracts key phrases, places, people, brands, or events
- Understands how positive or negative the text is
- Analyzes text using tokenization and parts of speech
- Automatically organizes a collection of text files by topic
- Sample use cases:
- analyze customer interactions (emails) to find what leads to a positive or negative experience. 分析客户互动(电子邮件)以找出导致积极或消极体验的原因。
- Create and groups articles by topics that Comprehend will uncover. 通过 Comprehend 发现的主题创建和分组文章。
15.5 Amazon SageMaker
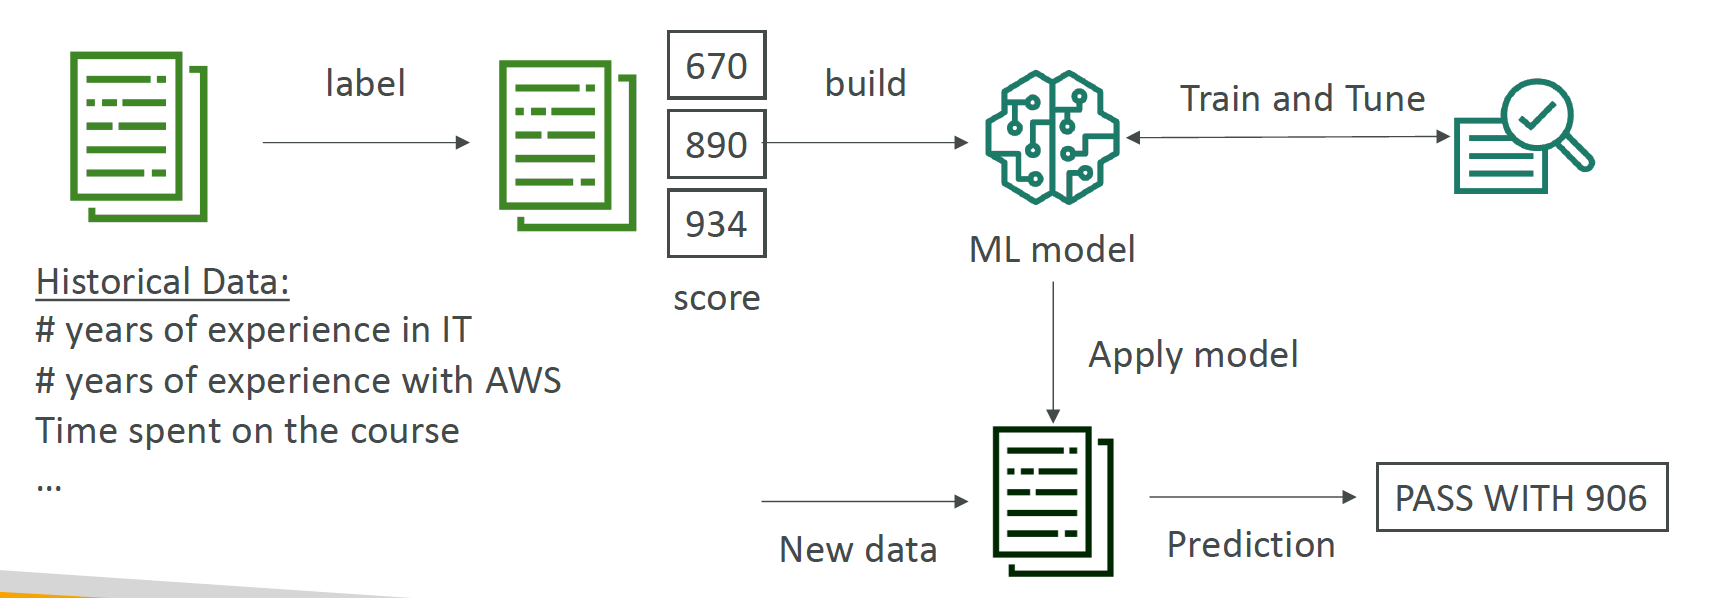
- Fully managed service for developers / data scientists to build ML models
- 通过完全托管的基础设施、工具和工作流程为任何用例构建、训练和部署机器学习模型。
- Typically, difficult to do all the processes in one place + provision servers
- Machine learning process (simplified): predicting your exam score
15.6 Amazon Kendra
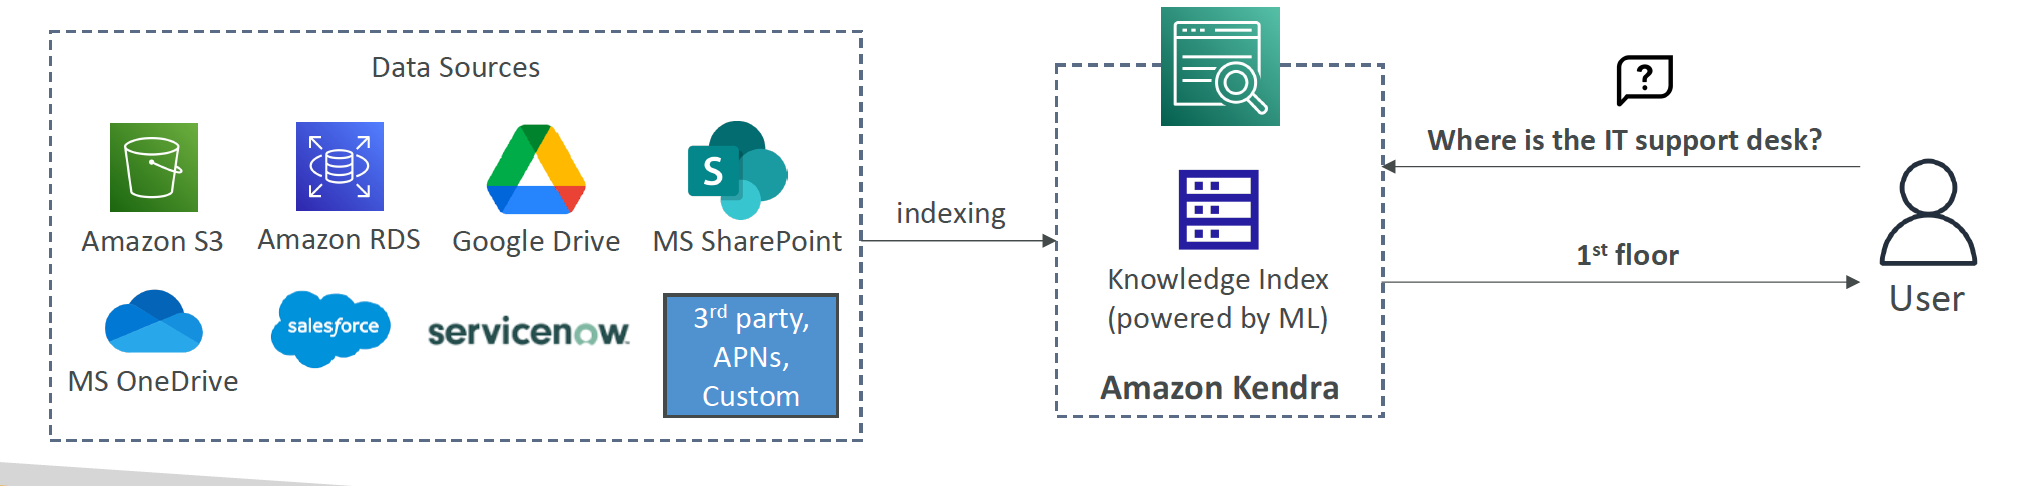
- Fully managed document search service powered by Machine Learning. 由机器学习驱动的完全托管文档搜索服务。
- Extract answers from within a document (text, pdf, HTML, PowerPoint, MS Word, FAQs…)
- Natural language search capabilities
- Learn from user interactions/feedback to promote preferred results (Incremental Learning). 从用户交互/反馈中学习以提升首选结果(增量学习)。
- Ability to manually fine-tune search results (importance of data, freshness, custom, …)
15.7 Amazon Personalize
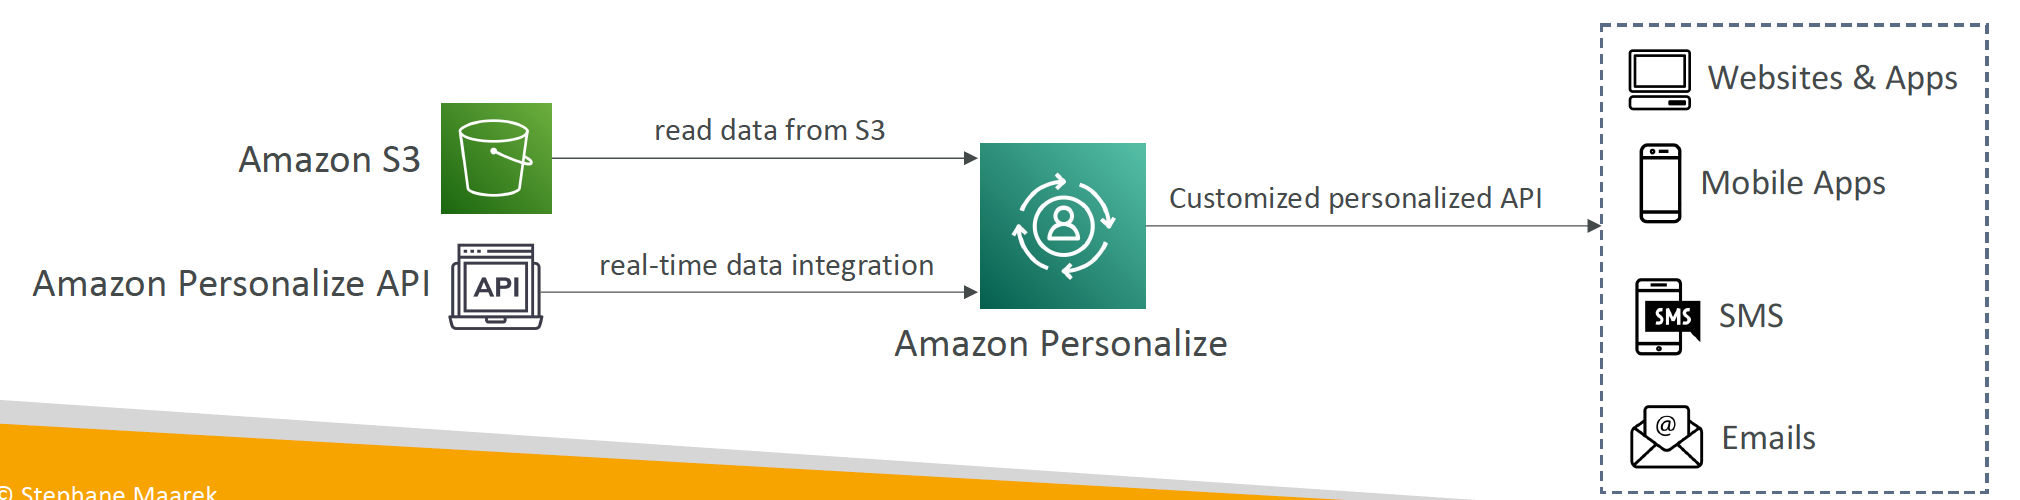
- Fully managed ML-service to build apps with real-time personalized recommendations. 用于构建具有实时个性化推荐的应用程序的完全托管 ML 服务。
- Example: personalized product recommendations/re-ranking, customized direct marketing
- Example: User bought gardening tools, provide recommendations on the next one to buy
- Same technology used by Amazon.com
- Integrates into existing websites, applications, SMS, email marketing systems, …
- Implement in days, not months (you don’t need to build, train, and deploy ML solutions). 在几天内实现,而不是几个月(您不需要构建,训练和部署 ML 解决方案)。
- Use cases: retail stores, media and entertainment…
15.8 Amazon Textract

- Automatically extracts text, handwriting, and data from any scanned documents using AI and ML. 使用 AI 和 ML 从任何扫描文档中自动提取文本,手写体和数据。
- Extract data from forms and tables
- Read and process any type of document (PDFs, images, …)
- Use cases:
- Financial Services (e.g., invoices, financial reports)
- Healthcare (e.g., medical records, insurance claims)
- Public Sector (e.g., tax forms, ID documents, passports)
15.9 AWS Machine Learning - Summary
- Rekognition: face detection, labeling, celebrity recognition. 人脸检测,标记,名人识别。
- Transcribe: audio to text (ex: subtitles). 音频转文字(例如:字幕)。
- Polly: Turn text into lifelike speech using deep learning. 使用深度学习将文本转换为逼真的语音。
- Translate: translations
- Lex: build conversational bots – chatbots. 构建对话机器人 - 聊天机器人。
- Connect: cloud contact center. 云联系中心。
- Comprehend: natural language processing
- SageMaker: machine learning for every developer and data scientist. 每个开发人员和数据科学家的机器学习。
- Forecast: build highly accurate forecasts. 构建高精度预测。
- Kendra: ML-powered search engine
- Personalize: real-time personalized recommendations. 实时个性化推荐。
- Textract: detect text and data in documents. 检测文档中的文本和数据。